Home sales in America just recorded one of their weakest July readings ever.
Existing home sales ran at an annualized pace of only 4.06 million in July 2026, compared with roughly 5.43 million in July 2019. That puts transactions about 25% below pre-pandemic norms and makes this the fifth-lowest July sales level on record.
Yet home prices remain historically expensive. The median sale price reached a record $434,000 in July, while mortgage rates remain in the 6% range.
That combination explains one of the strangest housing markets in modern history: Homebuyers Are Going on Strike.
Millions of Americans still want to own homes. But at today’s combination of prices, mortgage rates and monthly payments, many simply cannot afford to buy.
And beneath the national numbers, something even more interesting is happening. Luxury homes are still selling, while lower-priced markets in parts of the South and West are beginning to correct.
That divide could create some of the best opportunities buyers have seen in years.
Homebuyers Are Going on Strike as Sales Fall 25%
It’s difficult to overstate how weak housing demand has become.
The annualized pace of existing home sales reached 4.06 million in July 2026, down from 5.43 million during the same month in 2019.
That’s approximately a 25% decline from the pre-pandemic market.
The longer-term sales data puts that 25% decline into perspective. Existing home sales have remained near 4 million annualized for much of the last several years, a level normally associated with major housing downturns. July’s 4.06 million pace wasn’t simply weak; it was the fifth-worst July reading in 30 years.

And the situation looks even worse when adjusting transactions for the growing number of homeowners in America.
Only around 4.5% of owner-occupied homes have been transacted annually during the last four years.
During the 2008-2012 housing downturn, that figure was closer to 5%. During the brutal 1981-82 housing downturn, it fell to approximately 4%.
Adjusting sales for the size of America’s homeowner population reveals just how unusual the current freeze has become. The market has now spent roughly four years near a 4.5% turnover rate, below the approximately 5% level recorded during the 2008-2012 downturn. Only the early 1980s experienced a lower rate—and that contraction didn’t last nearly as long.

There’s an important difference, however.
The early 1980s downturn lasted roughly two years. The current housing slowdown has persisted for about four.
By transaction volume, America is experiencing something resembling a silent housing depression.
It doesn’t feel like one because home prices haven’t collapsed nationally. But when measured by how frequently Americans are actually buying and selling houses, today’s market is historically frozen.
Why Homebuyers Are Going on Strike
The explanation largely comes down to affordability.
Home prices surged during the pandemic and have remained elevated. At the same time, mortgage rates jumped dramatically from the ultra-low rates available in 2020 and 2021.
Even with rates now in the 6% range, monthly payments remain unaffordable for many households.
A buyer isn’t simply considering the price of a house. They have to qualify for—and comfortably afford—the resulting monthly payment.
When both prices and borrowing costs are elevated, something has to give.
This affordability squeeze has been building for years. The typical household now spends roughly 38% of its income on mortgage payments, helping explain why Americans are not buying houses despite continued interest in homeownership
So far, buyers have responded by refusing to transact.
That’s why housing demand can remain historically depressed even while home values stay high.
But the stalemate isn’t occurring everywhere.
Homebuyers Are Going on Strike, Except at the Top of the Market
One segment continues to show surprising strength: luxury housing.
Sales of homes priced at $1 million or more increased 14% year-over-year.
That matters for more than just wealthy buyers.
If expensive properties account for a larger percentage of all transactions, they can push national median and average sale prices higher—even if the typical housing market isn’t actually strengthening.
That could help explain why the national median sale price reached a record $434,000 in July despite historically weak transaction volume.
In other words, headline home prices may be giving an incomplete picture.
A larger share of affluent, less mortgage-sensitive buyers is still participating, while many traditional buyers remain sidelined.
If transaction volumes eventually normalize and more middle-income buyers return, median and average prices could actually decline simply because the composition of buyers changes.
The Housing Demand Collapse Is Creating Opportunities
There is a positive side to this historically weak demand environment.
Buyers who can afford to purchase suddenly have leverage.
That’s particularly true in markets where housing inventory has recovered significantly.
Across parts of the South and West, sellers are increasingly reducing asking prices. In some cases, properties are being listed $50,000 to $100,000 below what sellers paid near the peak of the pandemic housing boom.
That means real affordability—not just small price cuts—is beginning to return in certain pockets.
One example can be found in Bellevue, Washington, within the Seattle metro.
A high-end waterfront townhome recently reached an asking price of around $760,000.
That’s still expensive.
But the property is now priced nearly 25% below its peak valuation and has moved surprisingly close to its 2019 sale price.
The listing’s price history shows what this correction can look like at the property level. The Bellevue home approached a valuation of roughly $1 million near the 2022 peak, but its asking price has since fallen to $760,000. That puts the property much closer to where it traded before the pandemic housing boom.

That’s the type of listing buyers should be watching in today’s market.
Why Below-List Offers Are Becoming More Realistic
A discounted asking price doesn’t necessarily mean buyers should immediately pay the full amount.
Reventure’s Listing Analyzer suggests the Bellevue property could potentially support an offer between approximately $689,000 and $747,000, depending on market conditions, comparable sales and seller motivation.
Instead of treating the $760,000 list price as the property’s definitive value, the Listing Analyzer uses comparable properties, historical pricing, local market conditions, Reventure forecasts, and listing activity to estimate a potential negotiation range. In this case, all three modeled offer scenarios come in below the seller’s asking price.

Two metrics are particularly important when evaluating opportunities like this.
The first is True Days on Market.
A property that has effectively been sitting for 90 days has already received considerable feedback from buyers. The longer it remains unsold, the greater the possibility that the seller may entertain a serious below-list offer.
The second is how much the seller’s asking price has increased relative to the surrounding market.
In this example, the property is priced only around 5% above its 2019 sale price, while the broader market has appreciated approximately 62% over the same period.
That’s potentially a much more favorable setup for a buyer than purchasing a home whose seller is still demanding the full pandemic-era appreciation.
Housing Demand Could Weaken Further in Late 2026
Unfortunately for sellers, the housing slowdown may not be finished.
Several forward-looking indicators continue to show weak demand.
The weakness is also showing up in Reventure’s Housing Demand Index, which has remained near historically depressed levels as mortgage applications, pending sales, online home searches and buyer sentiment struggle to recover.
Mortgage purchase applications are trending below last year’s already depressed levels, while online searches for homes are also slowing.
These indicators occur earlier in the homebuying process than closed transactions, making them useful signals for where sales could be heading next.
Reventure expects housing demand to remain weak throughout the second half of 2026.
It’s even possible that the annualized existing home sales rate could fall below 4 million.
If that happens while inventory continues rising in weaker markets, sellers could face even greater pressure to negotiate.
The U.S. Housing Market Is Splitting in Two
The biggest mistake buyers can make right now is assuming that national statistics describe every local market.
They don’t.
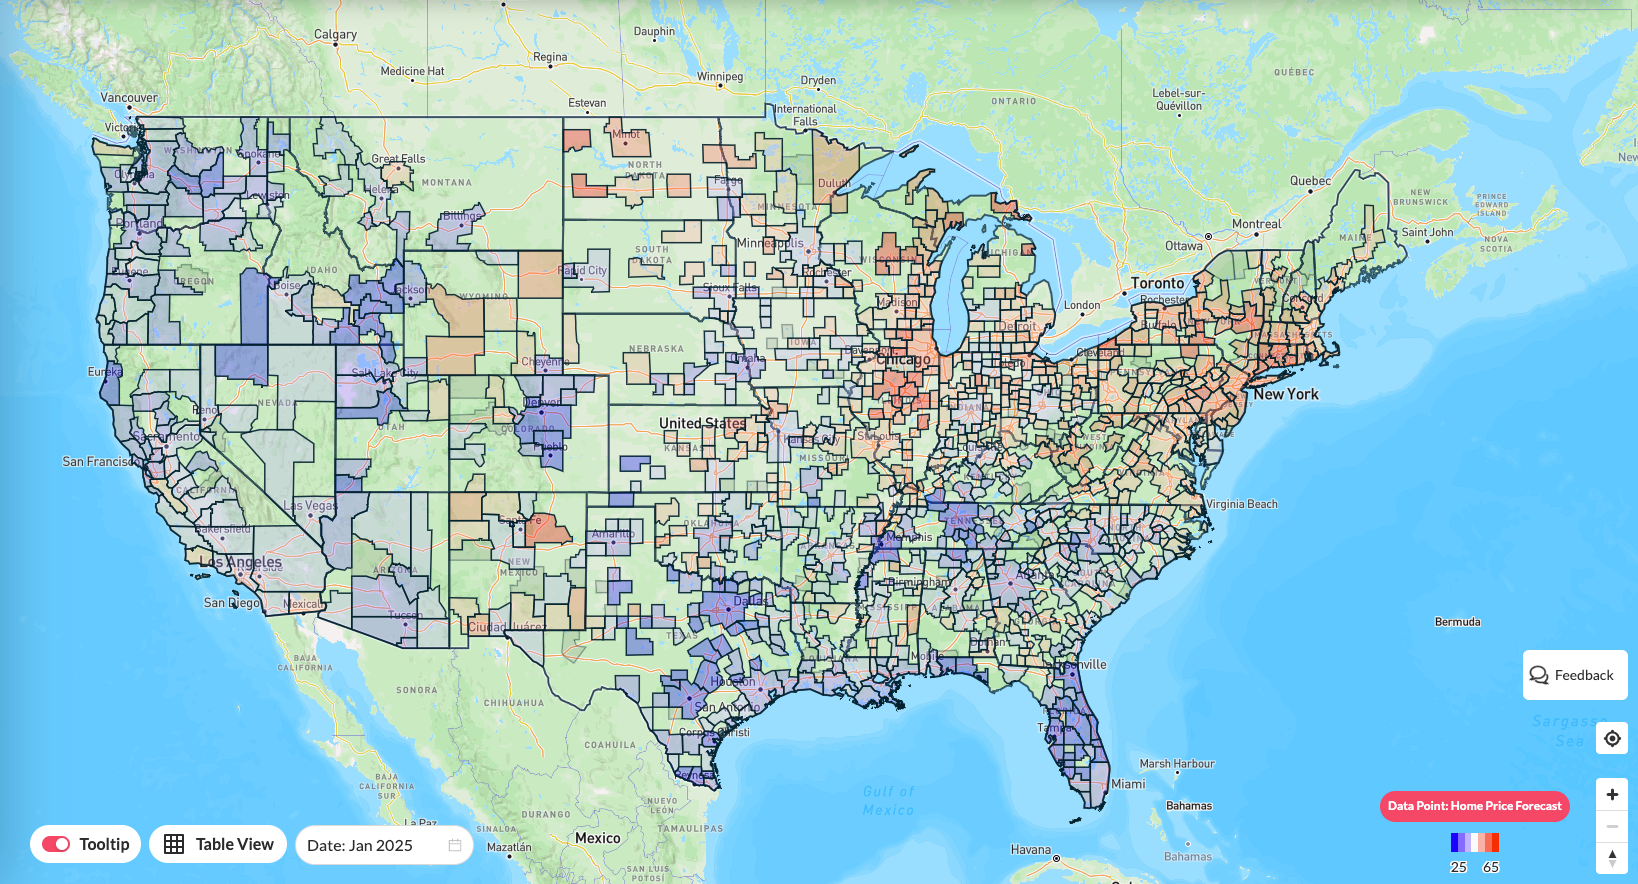
Luxury sales are rising. Some supply-constrained Northeast markets remain competitive. Meanwhile, parts of the South and West are seeing inventory increase, prices decline and sellers accept significant discounts.
That creates a remarkably fragmented housing market.
And it means today’s historically low demand could actually become an advantage for buyers who know where to look.
Instead of focusing only on asking price, buyers should examine how long a property has truly been listed, how much the seller has increased the price since purchasing it, comparable sales, local inventory, and the market’s forward price outlook.
The opportunity in today’s market isn’t simply finding a house with a price cut. It’s determining how far below list price the data actually supports offering. That requires looking at comparable sales, True Days on Market, local price trends, seller motivation, and the outlook for the surrounding housing market.

Reventure’s Listing Analyzer brings those data points together to help buyers determine a more informed offer range.
You can also track housing conditions for your ZIP code on Reventure, including local price forecasts and other market indicators.
Homebuyers Are Going on Strike because housing remains unaffordable nationally. But in markets where sellers are finally cutting prices, the strike may be creating exactly the leverage patient buyers have been waiting for.