U.S. Housing Affordability Crisis Is Not About Mortgage Rates. Home Prices Are 90% Too High

 September 9, 2026

The U.S. Housing Affordability Crisis is often blamed on mortgage rates.
But that explanation misses the bigger problem.
Today’s mortgage rates are around 6.5%, which is very close to the long-term historical average of roughly 6.4%. Rates were much higher throughout large parts of the 1970s, 1980s, and 1990s.
The real outlier today is home prices.
Real home prices are now roughly 90% above their long-term historical average.
That means housing has appreciated far faster than inflation and incomes.
And that gap is what has pushed buyers out of the market. The historical mortgage-rate data make this point clear. A 6.5% mortgage may feel expensive compared with the pandemic years, but it is almost exactly in line with the long-run U.S. average.

U.S. Housing Affordability Crisis Comes Down to Three Things
Housing affordability is ultimately a simple equation.
It depends on three variables: home prices, mortgage rates, and household incomes.
A market becomes unaffordable when the combined burden of prices and rates rises faster than incomes can support.
That is exactly what has happened.
Mortgage rates jumped sharply from their pandemic lows, but the 3% to 4% mortgage environment was never historically normal.
Those ultra-low rates only appeared after the Global Financial Crisis.
For decades before that, buyers regularly purchased homes with mortgage rates well above today’s levels.
The housing market functioned because home prices were much more aligned with incomes.
That is the critical difference.
Mortgage Rates Are Not the Historical Outlier
Today’s 6% to 7% mortgage rates feel expensive because buyers became accustomed to unusually cheap financing.
But historically, they are not extreme.
The real anomaly was 2020 and 2021.
Mortgage rates near 3% allowed buyers to qualify for much larger loans without dramatically increasing monthly payments.
That pushed purchasing power higher.
And sellers responded by raising prices.
The problem is that mortgage rates normalized while home prices barely adjusted nationally.
So buyers are now being asked to pay pandemic-era home prices with historically normal financing costs.
That is why affordability has deteriorated so dramatically.
Home Prices Are Driving the U.S. Housing Affordability Crisis
Real home prices are roughly 90% above their 136-year historical average. The contrast becomes much more obvious when we look at inflation-adjusted home prices. Unlike mortgage rates, home values are sitting far outside their historical range.

That is an extraordinary deviation.
Over more than a century of housing-market data, there has only been one other period when inflation-adjusted home prices reached similarly extreme levels.
That was around 2006 and 2007.
The market eventually corrected.
Meanwhile, there have been numerous periods when mortgage rates ranged from 5.5% to 7%, or even significantly higher, without causing a housing-market collapse.
That historical comparison matters.
The abnormal variable today is not interest rates. It is price.
Putting both series on the same chart shows why the current cycle is so unusual. Mortgage rates have spent plenty of time near or above today’s levels, while real home prices have rarely been this elevated.

And until prices move back toward levels supported by incomes and inflation, buyers will continue struggling to afford homes.
Why Sellers Are Refusing to Cut Prices
If prices are the problem, why have they not fallen more?
One major reason is the mortgage-rate lock-in effect.
Millions of homeowners secured mortgages at around 3% during the pandemic and immediately after it.
Those owners have little financial incentive to sell.
Someone with a 3% mortgage could see their payment increase dramatically by moving into a similar home with a 6.5% rate.
In some cases, staying put can reduce financing costs by nearly half compared with purchasing again today.
So many sellers simply wait.
If they do not receive the price they want, they pull the listing.
That behavior has helped keep national prices elevated even as transaction volumes have collapsed.
But this lock-in effect will not last forever. The composition of outstanding mortgages is already beginning to change. The share of homeowners with ultra-low rates is shrinking, while the share carrying mortgages above 6% is climbing quickly.

There are now more homeowners with mortgage rates above 6% than homeowners with rates below 3%.
That shift will continue.
Death, divorce, job relocations, household formation, and other life events will gradually replace ultra-low-rate mortgages with higher-rate loans.
A Bifurcated Housing Market Is Emerging
This could create a very unusual seller environment.
Owners with newer, higher-rate mortgages may be more willing to cut prices.
They have less incentive to protect a cheap loan.
Owners with 3% mortgages may behave very differently.
They can afford to wait.
That means two homes on the same street could have completely different pricing strategies.
One seller may accept a steep discount.
Another may remain listed well above comparable sales or simply withdraw the home altogether.
This bifurcation could become increasingly visible as the housing market moves deeper into the current cycle.
Can Wage Growth Fix the Affordability Problem?
Income is the third piece of the affordability equation.
In theory, rapidly rising wages could eventually make today’s prices affordable.
That happened during parts of the 1970s and 1980s.
Mortgage rates were extremely high, but wage growth was also strong.
Workers were often receiving annual wage increases of 7% to 9%.
Those gains helped households absorb rising prices and borrowing costs.
Today’s economy looks very different.
Average wage growth for U.S. payroll workers is currently around 3.2% year over year. That leaves income growth unable to do the heavy lifting. Unlike the inflationary decades of the 1970s and early 1980s, today’s workers are not receiving wage increases large enough to rapidly catch up with housing costs.

That is below the long-term historical average and far below the wage growth experienced immediately after the pandemic.
So incomes are not rising quickly enough to close the affordability gap.
That leaves the housing market boxed in.
Mortgage rates are roughly normal.
Wage growth is modest.
Home prices remain historically expensive.
And buyers are staying on the sidelines.
Housing Demand Shows How Far Prices Are From Clearing
Home sales are now roughly 25% below long-term norms. The transaction data shows what happens when prices remain above what buyers can support. Rather than buyers simply accepting higher costs, millions have stepped away from the market altogether.

The housing market is also entering its fourth year of depressed transaction activity.
That is a major warning sign.
A normal housing market requires buyers and sellers to meet at prices that both sides can accept.
Right now, that is not happening.
A market-clearing national price could potentially be 15% to 20% below current levels.
But many sellers still believe their homes are worth peak-cycle valuations.
That creates a strange situation where homeowners appear to have enormous equity on paper, but much of that equity cannot actually be realized across the entire market.
If everyone tried to sell at today’s valuations, there would not be enough demand.
A Home Price Correction Does Not Have to Crash the Economy
One common fear is that falling home prices would automatically create another 2008-style economic crisis.
That is not necessarily true.
Austin offers an interesting example.
Home values there have fallen roughly 27% from their recent peak. Yet Austin provides an important counterexample to the idea that falling home prices automatically cause an economic crisis. Even after a major housing correction, the local labor market has remained relatively stable.

Yet unemployment remains around 3.7%, and payrolls are still growing.
The local economy did not collapse simply because home prices corrected.
The broader difference today is household leverage.
Homeowners generally carry less mortgage debt relative to their equity than they did before the last housing crash.
That gives households more capacity to absorb lower prices.
A correction could even improve economic activity by making housing more affordable, increasing home sales, encouraging moving, and creating more renovation activity.
Home Prices Have to Give
The U.S. Housing Affordability Crisis will not be fixed simply by waiting for mortgage rates to return to 3%.
Those rates were historically abnormal.
The deeper problem is that home prices remain dramatically disconnected from long-term fundamentals.
Real home prices are roughly 90% above historical norms, wage growth is modest, and home sales remain deeply depressed.
Something eventually has to adjust.
And if rates remain near historical averages while incomes grow slowly, that adjustment is most likely to come through prices.
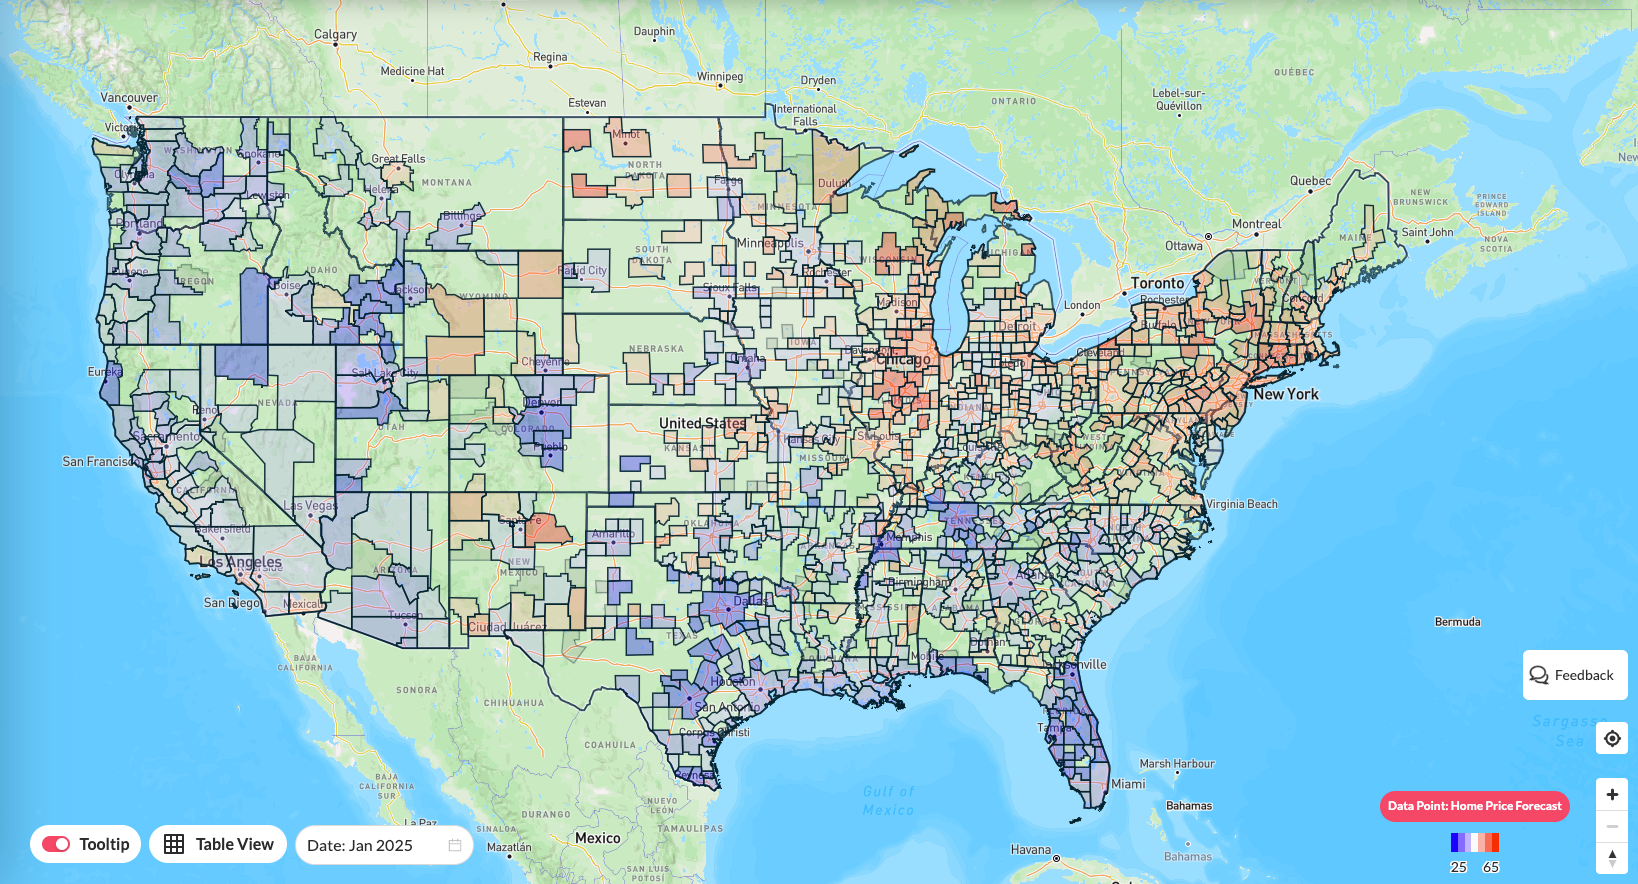
Of course, housing is local.
Some markets are already correcting while others continue appreciating.
That makes it critical for buyers, sellers, and investors to understand where their market stands before making a decision.
You can track local valuations, price trends, and the 2027 housing forecast for your area with Reventure Premium at Reventure.app.
Because fixing affordability ultimately comes down to one thing.
Bringing home prices back to levels buyers can actually afford.