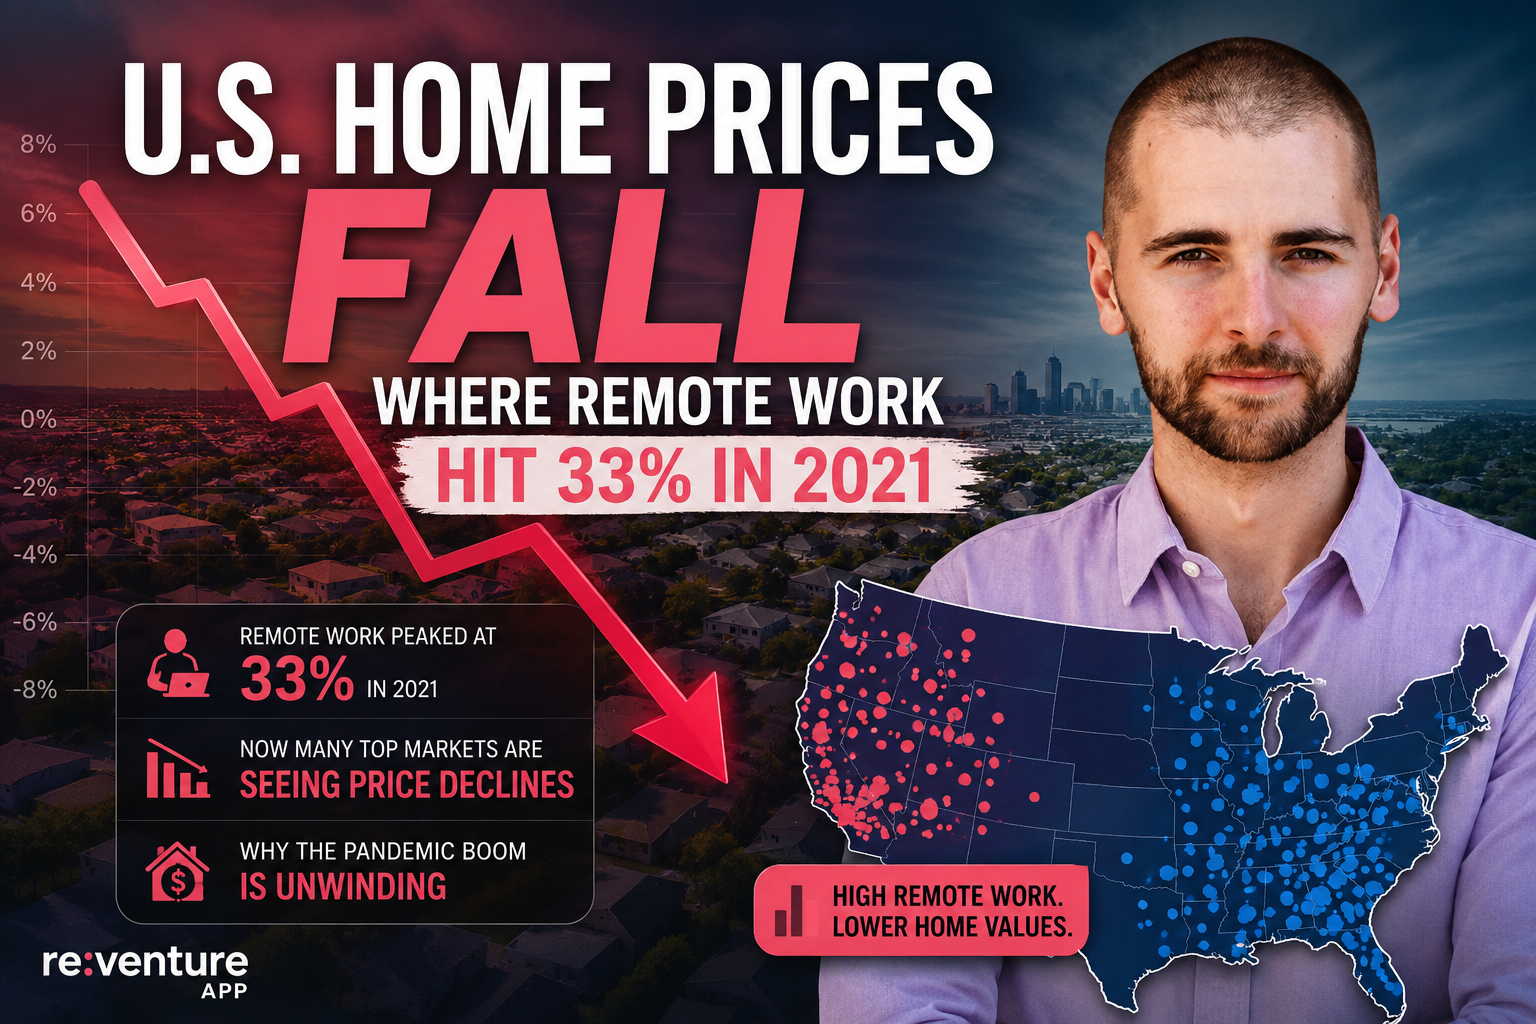
U.S. Home Prices Fall Where Remote Work Hit 33% in 2021. This single statistic captures one of the biggest shifts happening in today’s housing market.
During the pandemic, counties with the highest concentration of remote workers experienced some of the fastest home price appreciation in America. Buyers left expensive urban centers, searched for larger homes, and fueled record demand across suburban and Sun Belt markets.
Fast forward to 2026, and the trend has completely reversed.
Many of those same counties are now recording flat or declining home values. This reversal also supports the broader trend discussed in our analysis of the U.S. housing bubble, showing signs of becoming bigger than 2006, where formerly booming markets are experiencing some of the sharpest corrections.
Markets like Collin County, Travis County, Denver County, Mecklenburg County, and St. Johns County have become some of the weakest performers despite leading the remote work boom just a few years ago.
The reason is straightforward. Remote work is no longer expanding. Companies are calling employees back to the office, artificial intelligence is reshaping white-collar employment, and migration patterns are becoming more localized.
This doesn’t mean every remote-work market is declining. There are notable exceptions, including San Francisco, where the AI boom has revived demand.
Our recent report on why San Francisco home prices are surging despite weakness in other tech markets explains how AI investment is creating a very different housing story than elsewhere.
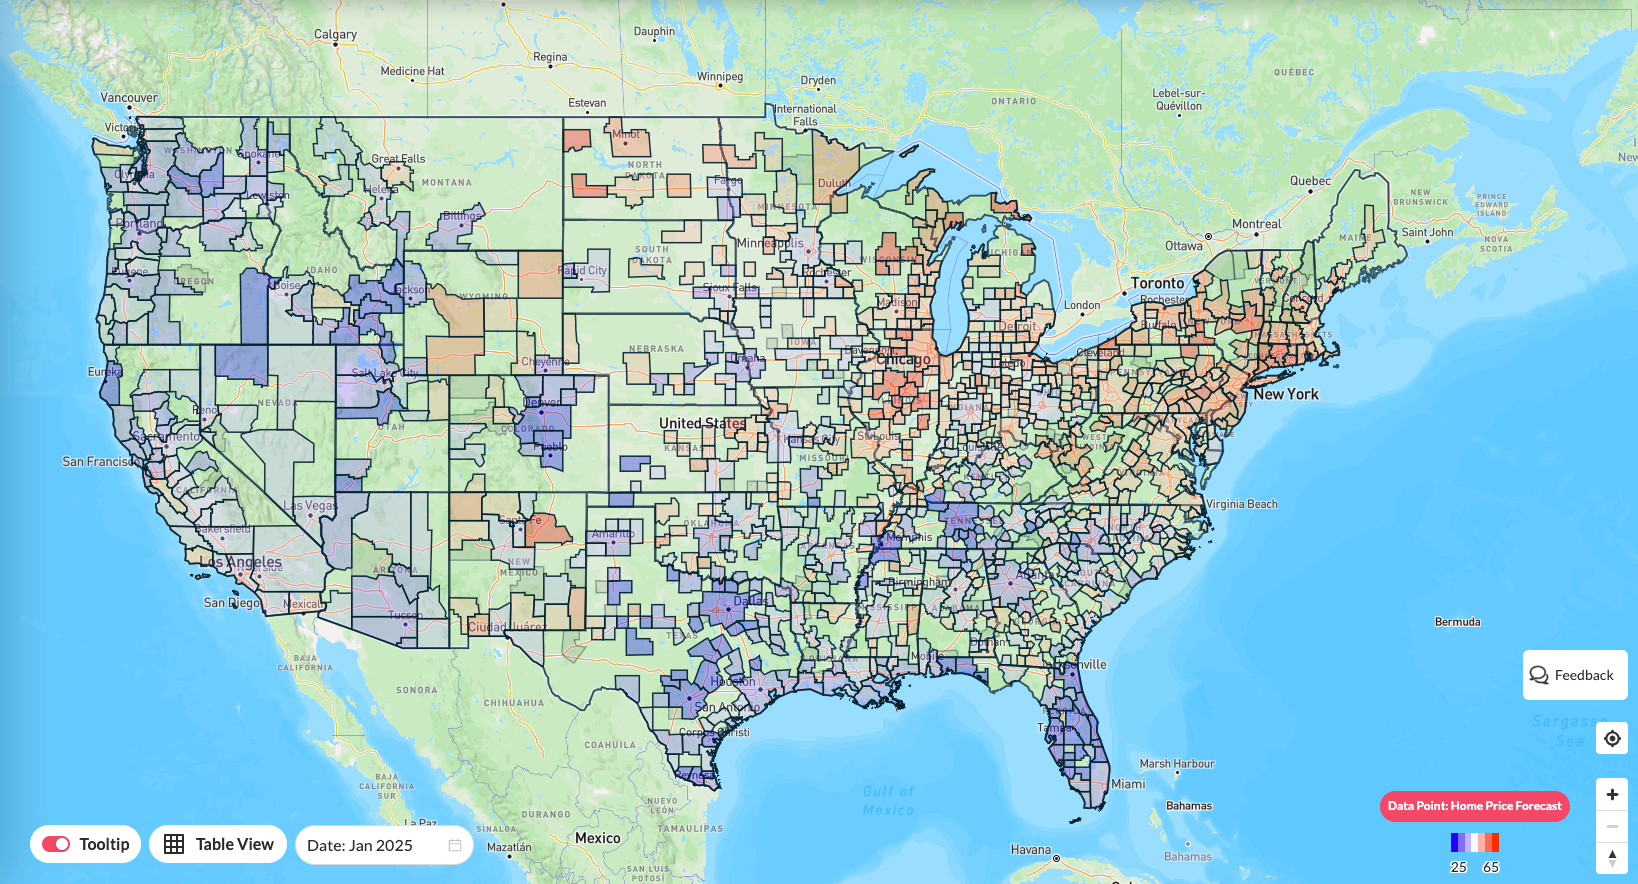
The broader national data makes this relationship easy to see. While the correlation isn’t perfect, counties with higher shares of remote workers are generally experiencing weaker home value growth than markets where fewer people work remotely.

Why U.S. Home Prices Fall Faster in High Remote-Work Markets
The biggest driver behind this trend is changing demand.
During 2020 and 2021, millions of Americans could work from anywhere. Employees no longer needed to live close to downtown offices, allowing them to relocate to lower-cost suburbs and fast-growing Sun Belt cities. That migration fueled bidding wars and pushed home prices to record highs.
Today, those same migration patterns are slowing. Hybrid work remains common, but fully remote employment has steadily declined from its 2021 peak. Employers across technology, finance, and professional services increasingly expect workers to spend more time in the office.
As a result, U.S. home prices fell because many homeowners are once again relocating closer to employment centers. At the same time, layoffs within parts of the technology sector are adding more supply to markets that were previously driven by remote workers.
Higher inventory combined with softer demand creates downward pressure on prices.
While the national trend is clear, the relationship becomes even stronger when we isolate individual states. Texas provides one of the best examples.
Counties with the highest percentage of remote workers are now consistently posting the weakest home value growth, while counties with lower remote-work exposure continue to outperform.

The trend is difficult to ignore. Collin County, Travis County, Williamson County, Denton County, and Hays County all sit in the bottom-right corner of the chart, combining some of the highest remote-work rates in Texas with some of the largest home value declines.
Meanwhile, counties with lower remote-work exposure generally continue to record positive appreciation.
The pattern doesn’t stop in Texas. Arizona shows a similar relationship, suggesting the reversal of remote-work housing demand is part of a broader regional shift rather than a Texas-only trend.
Counties with higher remote-work exposure generally appear on the weaker side of Arizona’s housing market, while lower-remote-work counties are holding up better.

Collin County, TX, Shows How Quickly Housing Markets Can Change
Few markets demonstrate this reversal better than Collin County, Texas.
Before the pandemic, only about 9% of workers in the county worked remotely. By 2021, that figure had surged to roughly 33%, making Collin County, TX, one of the largest remote-work hubs in America.
The chart below shows just how extraordinary that increase was. Remote work more than tripled in only a few years before gradually retreating as companies began implementing return-to-office policies.

The rapid increase helped fuel extraordinary home price growth. Buyers moved from Dallas, California, and other expensive markets seeking larger homes and more space. Competition intensified, pushing prices far beyond what local income growth could sustainably support.
That surge was never likely to continue indefinitely.
As remote work normalized and migration slowed, the market lost one of its biggest drivers of demand. Inventory increased, affordability deteriorated, and home values began correcting. Today, Collin County ranks among the weakest-performing large housing markets in the country.
We recently explored this trend in greater detail in our analysis of the Collin County housing market correction, where prices have fallen nearly 10% from their peak despite strong local incomes and job growth.
Its experience illustrates an important lesson: housing booms driven primarily by migration can reverse quickly when those migration patterns change.
Low Remote-Work Markets Are Seeing Stronger Housing Demand
Interestingly, some of America’s strongest housing markets have relatively low levels of remote work.
Take the Bronx in New York City. Only about 6.7% of workers operate remotely, only slightly above pre-pandemic levels. Yet home values there continue to post solid annual gains exceeding 5%.
Unlike many Sun Belt markets, remote work never became the dominant employment model in the Bronx. That stability has helped support stronger housing demand as workers continue commuting to nearby employment centers.

The difference comes down to local employment. Rather than depending on pandemic migration, markets like the Bronx benefit from residents working close to hospitals, schools, government offices, transportation, and other location-dependent industries.
The same trend appears across much of the Midwest and Northeast.
Many manufacturing-heavy counties continue to experience healthy housing demand because employment growth remains closely tied to local economies rather than remote positions.
These markets never experienced the explosive pandemic appreciation seen in many Sun Belt locations, which also means they avoided much of today’s correction.
Local Employment Is Becoming More Important Than Migration
The housing market is entering a new phase.
During the 2010s and especially the pandemic years, migration was one of the biggest drivers of home price growth. Buyers relocated across states with unprecedented freedom, allowing many markets to appreciate regardless of local employment conditions.
That environment is fading.
As companies continue emphasizing office attendance and AI reshapes knowledge-sector employment, local job creation is once again becoming the dominant force behind housing demand.
This shift helps explain why some traditional employment centers are outperforming while several former migration hotspots continue cooling. Markets with expanding manufacturing, healthcare, logistics, and industrial employment are increasingly attracting stable buyer demand.
The geographic distribution of today’s strongest housing markets supports this conclusion. Counties with the fastest home value appreciation are increasingly concentrated across the Midwest and Northeast, regions benefiting from stronger manufacturing and industrial investment.

Meanwhile, areas that relied heavily on remote workers or pandemic migration are finding it more difficult to sustain previous price levels.
The contrast becomes even clearer when looking at counties with declining home values. Many of the biggest corrections remain concentrated across the Sun Belt, Mountain West, and former pandemic boomtowns.

This doesn’t guarantee further declines everywhere, but it does suggest that employment fundamentals will play a much larger role in determining future home price performance.
What Buyers and Investors Should Watch Next
The story behind the U.S. home prices fall extends well beyond remote work itself.
It highlights how quickly housing markets can change when demand shifts. Pandemic migration created extraordinary winners between 2020 and 2022. Now, many of those same markets are adjusting to a very different economic environment.
For buyers, investors, and homeowners, the most important indicators going forward will be inventory levels, local employment growth, affordability, and migration patterns—not simply national headlines.
Markets tied to expanding industries may continue outperforming, while former remote-work hotspots could face additional pressure if supply continues rising.
To stay ahead of these changing trends, use the Reventure App to track home values, inventory, affordability, and local housing forecasts at the ZIP code level.
Understanding where demand is strengthening or weakening can help you identify tomorrow’s housing winners before the broader market catches on.