

Boston’s year-over-year (YoY) home value growth slowed down to 5.1% in late 2024, marking a departure from the double-digit growth rates seen in previous years, as it was 10.7% in 2021. However, this doesn’t suggest home prices are dropping. Instead, it points to a more moderated real estate market.
According to Reventure App, Boston’s median home value increased from $660,191 in November 2023 to $694,493 in November 2024. At the same time, housing inventory remains constrained, with homes for sale down 16.9% compared to the long-term average. This persistent scarcity of supply continues to challenge buyers and sustain competition in the market.

Boston’s home value growth remains steady at 5.1% YoY in late 2024. Access the above graph here. [Link]
Boston’s real estate market has been characterized by consistent rises in home values since 2020. At the start of that year, the median home value was about $520,000. By 2024, it has climbed to $694,400, a significant increase over four years.
However, the pace of growth has tempered after hitting a peak YoY increase of 10.7% in 2021. By late 2024, this growth has slowed to 5.1%. This gradual tapering reflects a market transition from rapid appreciation to a more stable growth trajectory.
Home Value Growth Differences in Boston, MA’s Counties
Within the Boston Metro area, counties show varying levels of home value growth. As highlighted by Reventure App’s data, Strafford County saw the highest YoY growth rate at 6.3%, with Rockingham County following at 5.8%. Meanwhile, Essex and Middlesex counties reported moderate growth rates of 5.5% and 5.0%, respectively, consistent with steady market dynamics.

As shown by the Reventure App’s map, Strafford County has the highest home value growth. Access the map here. [Link]
However, growth slowed further in Norfolk and Plymouth counties, both recording growth between 4.9% and 5.0%. These differences indicate that while the Boston Metro as a whole remains competitive, demand and market vitality vary significantly by county. It’s important to note that the New Hampshire counties are seeing the highest home value growth in the Boston Metro Area. You can do a deep county level analysis on Reventure App.
Factors Impacting Home Value Growth in Boston, MA
Several factors are influencing home value growth in Boston, MA. Low inventory levels remain a key driver. The number of homes for sale is down by 16.9% compared to the long-term average, creating heightened competition among buyers. Even as sale inventory growth shows signs of recovery at 13.0% YoY, the shortage of available homes continues to sustain upward pressure on values.
Furthermore, while the median listing price declined slightly to $819,900, it reflects sellers adjusting to changing market dynamics rather than an actual reduction in property values. The rising mortgage payments in the Boston Metro area are also critical to home value growth.
As home prices have climbed, with a median value now at $694,493, the cost of financing these purchases has significantly increased. Moreover, according to data on Reventure App, mortgage payments have surged from $2,387 in 2019 to $4,707 in 2024, which is reflecting rising home values and higher interest rates.
Boston, MA’s Home Value Growth in 2025
Looking ahead, Boston’s real estate market is expected to maintain stability through 2025. The Home Price Forecast score for 2024 stands at 55/100, indicating a balanced outlook with room for steady growth. It’s important to note that a score below 45 denotes a declining market, between 45 and 55 represents stability, and above 55 indicates an appreciating market on Revanture App.
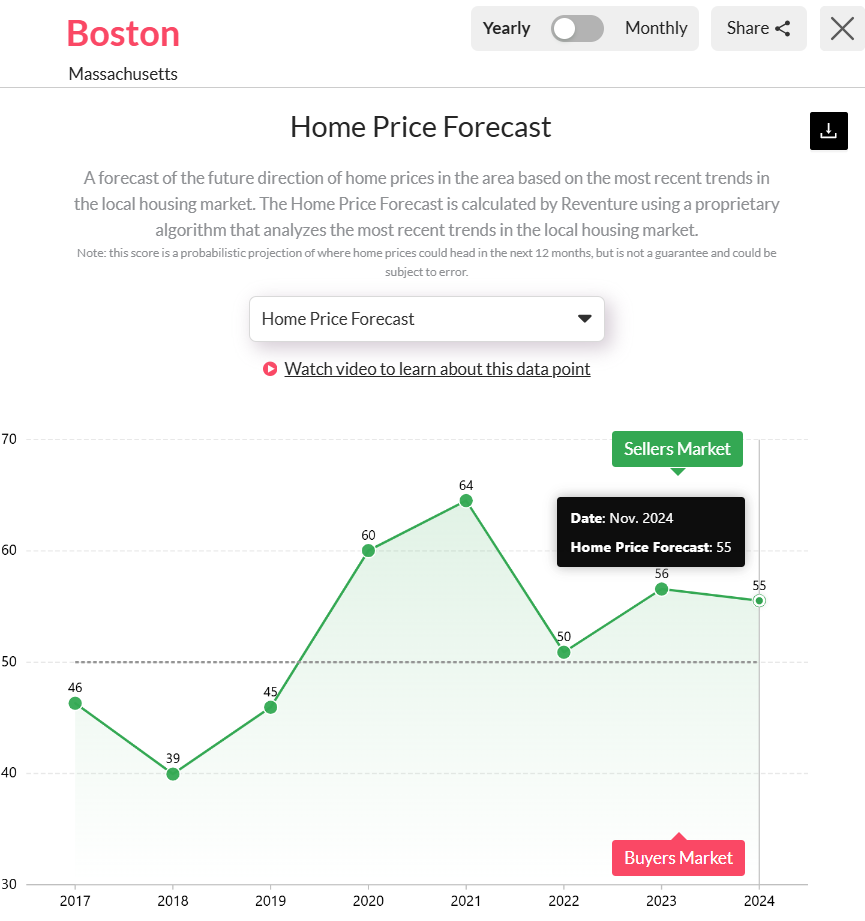
Boston’s housing market remains a seller’s market with a stable upward tilt, reflected in a Home Price Forecast score of 55 for 2024. Access the details here. [Link]
The stability of Boston’s market contrasts sharply with some other U.S. housing markets, where reduced buyer demand, longer days on the market, and frequent price cuts signal a cooling effect. Instead, due to the enduring inventory deficit, the seller’s market conditions remain intact. Moreover, the rising mortgage payments and affordability challenges will cause buyer demand to persist, keeping the market a seller’s market.
Therefore, if current trends hold, 2025 will likely see continued stable growth rather than the price spikes or downturns observed in more volatile markets. For more detailed market data and analysis, access the housing market data at a ZIP-code level in Boston, MA, on the Reventure App.


One Response