Are Investor-Heavy Housing Markets Starting to Break? Home Prices Fall 20%

 September 1, 2026

Something is breaking in America’s Investor-Heavy Housing Markets. During the pandemic housing boom, investors flooded markets like Atlanta, Jacksonville, Charlotte, Baltimore, and Phoenix. In some ZIP codes, investors accounted for more than 40% of home purchases in 2022, providing an enormous additional source of demand.
Now that demand is disappearing.
Many of the ZIP codes with the highest investor concentration have experienced home-value declines of 15% to 20% or more. Meanwhile, areas that attracted relatively few investors during the pandemic have generally experienced stronger appreciation.
The relationship isn’t perfect. Local employment, affordability, construction, migration, and inventory all influence prices. But investor activity in 2022 alone explains roughly 17% of the variation in subsequent home-price growth across the markets analyzed.
That suggests the pandemic investor boom may have created a vulnerability that is only now becoming clear. The relationship becomes much clearer at the ZIP-code level. Areas with the highest investor share purchases in 2022 generally shifted toward weaker home-price performance afterward, while many ZIP codes with relatively little investor activity experienced stronger growth.

The extremes are especially revealing. Several ZIP codes where investors represented 40% or more of purchases have since experienced price declines of roughly 15% to 20% or more.
Investor-Heavy Housing Markets Are Seeing Bigger Price Declines
Investors provided a powerful demand boost from 2018 through 2022.
Institutional buyers, small landlords, house flippers, and other investors competed with traditional homebuyers, particularly across affordable Sun Belt markets. In some neighborhoods, investor purchases became a major share of total transactions.
That worked well while investors were buying.
But investor demand can be considerably more sensitive to financial conditions than owner-occupant demand. A family may buy because it needs somewhere to live. An investor generally buys because the numbers produce an acceptable return.
When those numbers stop working, demand can disappear quickly.
That’s increasingly what we’re seeing.
The ZIP codes with some of the highest investor shares during the boom are disproportionately appearing among today’s weaker housing markets. In neighborhoods across Atlanta, Baltimore, and Phoenix, values have fallen 15% to 20% or more from their highs.
Why Investor-Heavy Housing Markets Can Be More Volatile
Homebuyers sometimes assume heavy investor activity is bullish.
After all, if professional investors are buying in a neighborhood, shouldn’t that signal strong future appreciation?
The problem is what happens when those investors leave.
A market where investors represent 5% of purchases loses relatively little demand if investors pull back. A neighborhood where they represent 30% or 40% can experience a much larger shock.
And the problem becomes even more significant if previous investors begin selling properties at the same time.
Atlanta provides one of the clearest examples.
Atlanta’s Investor Boom Has Reversed
Atlanta was one of America’s most popular investor markets during the pandemic.
Using Redfin investor data, purchases peaked at approximately 12,807 before collapsing to around 2,918—a roughly 77% decline from the peak based on the figures in the underlying analysis.
Investor buying has fallen back toward levels last seen around 2012–2016 and sits roughly 55% below pre-pandemic norms.
The historical trend shows just how unusual Atlanta’s pandemic investor boom became. Purchases surged to 12,807 around the 2021–22 peak before collapsing to just 2,918 in 2026, erasing most of the previous decade’s expansion in investor demand.

That matters because investor demand had become an important source of support for certain Atlanta neighborhoods. When that demand disappears this quickly, heavily investor-owned ZIP codes can suddenly face a very different supply-and-demand environment.
That’s more than normalization.
During the boom, investor demand helped support Atlanta home prices, particularly in neighborhoods where investors accounted for an unusually large percentage of transactions. Today, that same source of demand has largely disappeared.
Some investors are also becoming sellers.
That creates the possibility of a demand-and-supply reversal: fewer investors bidding on homes while existing investor-owned properties return to the market.
The Investor Exodus Is Spreading Beyond Atlanta
Atlanta isn’t an isolated example.
Jacksonville has experienced a similarly dramatic reversal. Investor purchases are approximately 77% below their 2022 peak and have fallen toward their lowest levels since roughly 2013–2015. Jacksonville’s reversal is remarkably similar. Investor purchases exploded to 3,399 around the 2021–22 peak before falling to only 791 in 2026, putting activity back near levels last seen around 2013.

Jacksonville, therefore, isn’t simply experiencing slower investor growth. Most of the extraordinary demand that entered the market during the pandemic has effectively disappeared.
Investor-heavy Jacksonville ZIP codes are already experiencing falling home values.
Charlotte is another market seeing a significant contraction.
Across the metros tracked in the analysis, three have experienced investor-purchase declines of at least 70% from their 2022 highs, while another seven are down by more than 60%.
Jacksonville is down approximately 77%, Atlanta more than 70%, and Charlotte around 70%. The broader metro rankings show this isn’t confined to one or two overheated markets. Investor purchases have fallen by more than 60% from Q2 2022 levels across numerous Sun Belt and Western metros, including Orlando, Nashville, Las Vegas, Phoenix, Tampa, and Denver.

The geographic breadth of the decline points to a common national force rather than a purely local problem. The economics of purchasing a rental property have changed dramatically since mortgage rates began rising.
The question is why investors disappeared so quickly.
High Mortgage Rates Broke the Investor Math
The biggest problem is simple: financing costs.
A conventional rental investor cares about the relationship between the income generated by a property and the cost of financing it.
During much of the 2010–2021 period, that relationship was unusually favorable.
Mortgage rates frequently sat below single-family rental cap rates. At certain points, the financing spread reached roughly +2 percentage points, making leveraged real-estate investment extremely attractive.
Today, the equation has reversed.
The 30-year fixed mortgage rate is around 6.5%, while the single-family rental cap rate in the analysis is approximately 4.9%.
That’s a financing spread of roughly -1.6 percentage points before accounting for other expenses. The financing spread shows how radically the investment equation has changed. For most of 2010–2021, rental cap rates exceeded mortgage rates, but since 2022 borrowing costs have moved decisively above property yields.

That reversal helps explain why investor purchases have fallen so dramatically. An investment strategy that produced positive leveraged cash flow during the low-rate era can become unattractive when financing costs exceed the property’s underlying yield.
For investors using debt, that makes many conventional single-family rentals difficult to justify financially.
Investor-Heavy Housing Markets Lost Their Cheap-Money Advantage
The shift raises a bigger question about the previous housing cycle.
Perhaps 2010 through 2021 wasn’t normal.
Home prices had crashed during the Great Financial Crisis, pushing investment yields higher. At the same time, historically low interest rates made borrowing exceptionally cheap.
Investors received both relatively attractive cap rates and inexpensive financing.
The pandemic eventually pushed that environment to an extreme. Investors rushed into affordable Sun Belt markets, home values surged, and rental yields compressed.
Then mortgage rates jumped.
Investors were suddenly left with expensive properties, relatively low cap rates, and financing costs above the yields those properties generated.
The investment thesis changed almost overnight.
New Regulations Could Reshape Institutional Demand
Investor demand could face another structural headwind from federal housing policy.
According to the X thread, the ROAD to Housing Act became law in July and includes restrictions beginning in January 2027 affecting large corporate investors that control at least 350 single-family homes. The thread says those investors would generally be restricted from purchasing additional existing single-family properties, subject to exceptions including certain build-to-rent and renovation activity.
If implemented as described, that would matter because it arrives while institutional demand is already weak.
Even if falling mortgage rates eventually improve investment returns, the largest corporate buyers could face greater restrictions on purchasing existing homes.
Smaller investors would still participate, and institutional capital could continue flowing into new construction. But the investor landscape could look very different from the one that dominated parts of the 2010s and the pandemic boom.
What Happens Next to Investor-Heavy Housing Markets?
The bigger risk isn’t that every investor-driven ZIP code will crash.
Housing remains intensely local. Employment growth, new construction, migration, household income, insurance costs, affordability, and inventory can outweigh investor concentration in individual markets.
But the data provides an important warning.
Investor concentration can amplify housing cycles.
Heavy investor buying can push demand and prices higher during a boom. When financing conditions change, that demand can disappear much faster than traditional owner-occupant demand.
That’s why buyers shouldn’t automatically interpret high investor activity as evidence that a neighborhood is a safe investment.
The more important question is whether local housing fundamentals can support prices without unusually high investor demand.
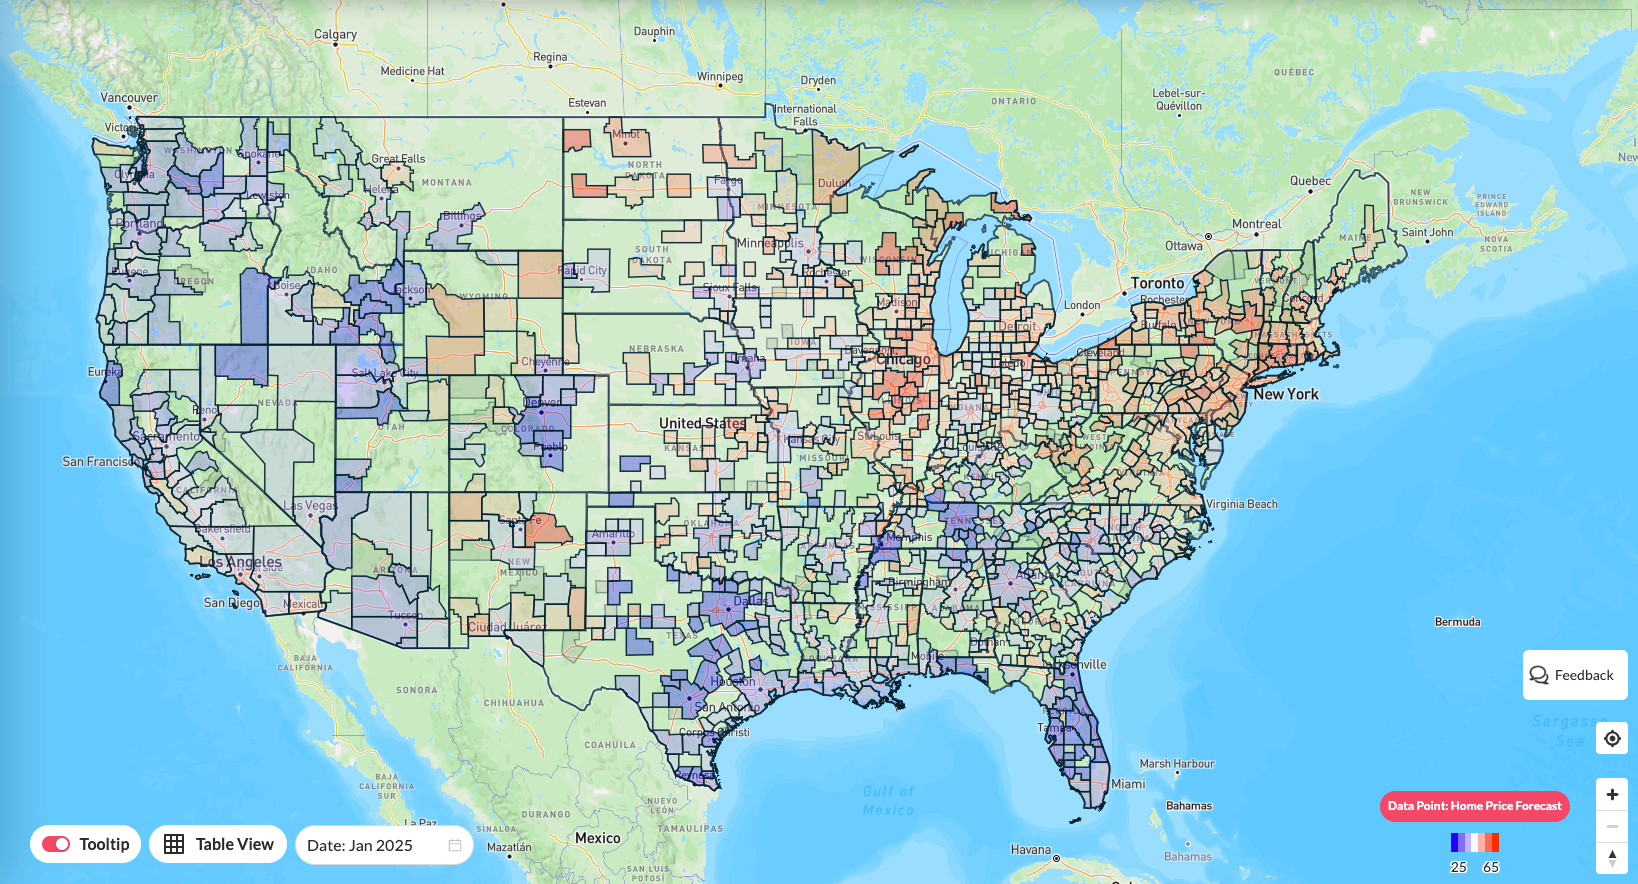
Reventure App’s 2027 ZIP code forecasts can help buyers and investors examine that risk at the local level, alongside inventory, valuations, home prices, and other housing fundamentals across nearly 30,000 U.S. ZIP codes.
The pandemic demonstrated what happens when investors rush into housing simultaneously. The next several years could reveal the other side of that trade.
And in America’s most Investor-Heavy Housing Markets, that reversal may already be underway.