Why Is Housing So Unaffordable? Home Prices Are 90% Above Historical Norms

 September 3, 2026
The U.S. homebuilder recession just got worse.
Months of supply for new homes have climbed north of 9.0 months, putting builder inventory near levels last seen around the 2008 housing crash. There have only been a handful of periods in modern U.S. history when builders were sitting on this much supply.
And almost all of them occurred around recessions.
That sounds ominous for the economy. But for homebuyers, there is another side to this story.
Builders are responding to weak demand the only way they can: cutting prices and offering increasingly aggressive incentives.
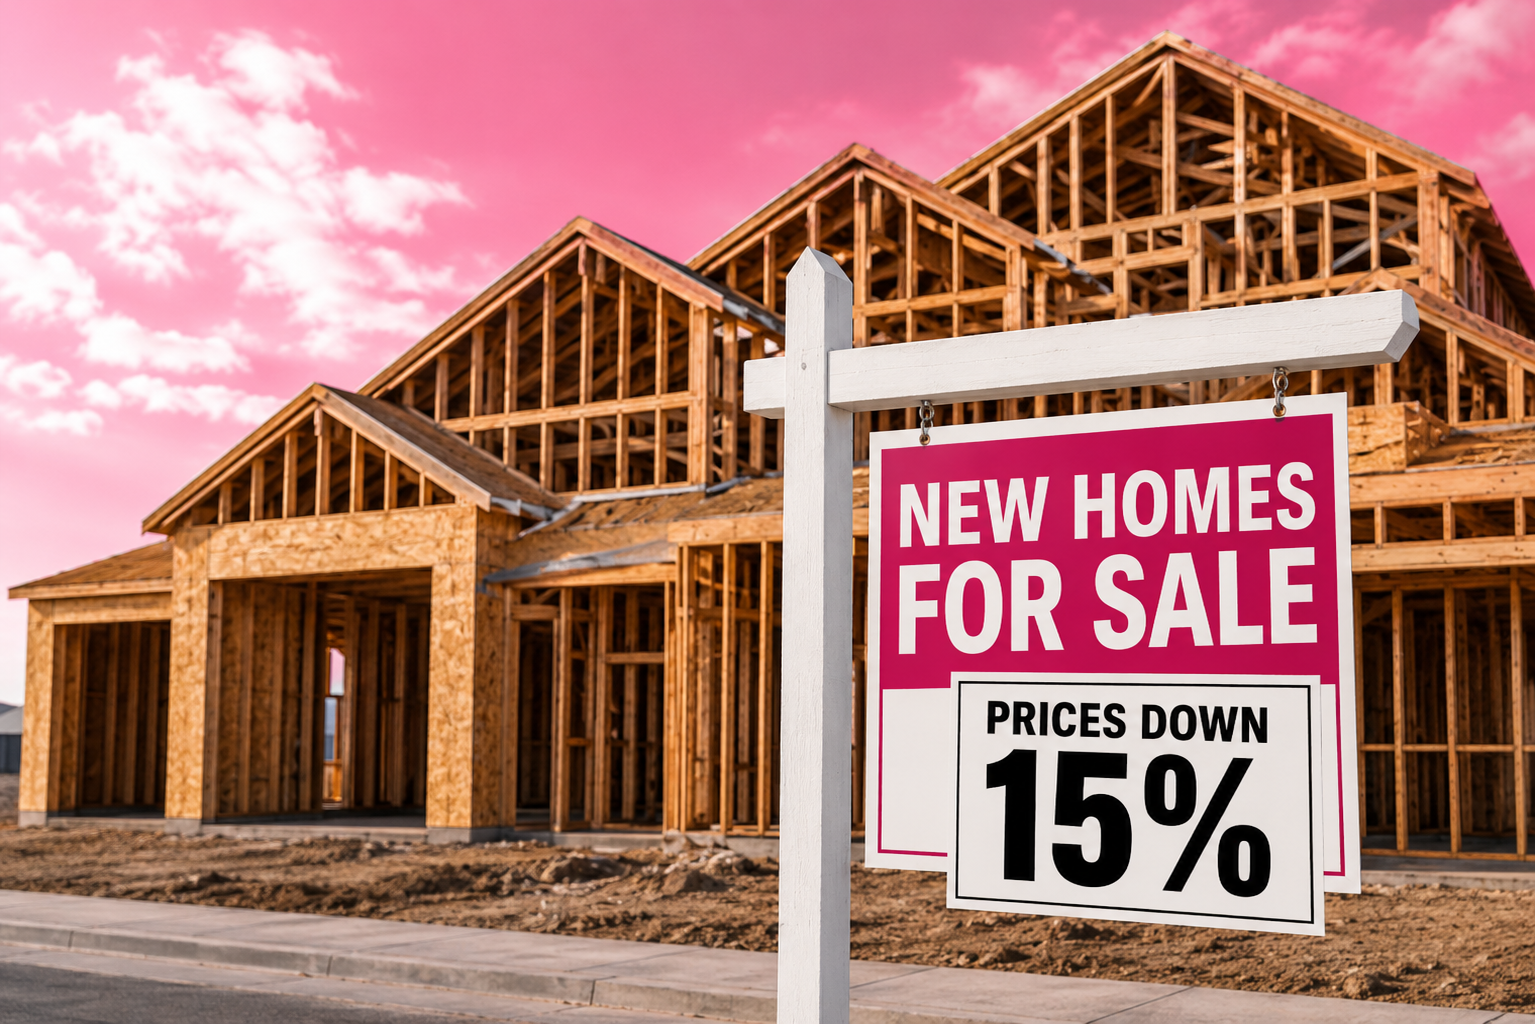
Median new-home sale prices have already fallen nearly 15% from their 2022 peak. Add mortgage-rate buydowns and other incentives, and the effective decline could be considerably larger.
After four years of historically bad affordability, the homebuilding market is finally beginning to adjust.
Why Is Housing So Unaffordable as Builder Supply Surges?
The connection between builder inventory and the economic cycle is relatively straightforward.
Homebuilders are extremely sensitive to changes in affordability, interest rates, and consumer confidence. When mortgage payments become too expensive and households become nervous about their financial future, buyers pull back.
Sales decline.
But builders can’t immediately eliminate homes already under construction or completed. So when demand disappears faster than supply can adjust, unsold inventory begins accumulating.
That’s essentially what is happening now.
Months of supply have climbed above 9.0, a level comparable to the period leading into the Great Financial Crisis.
Historically, readings this high have been rare. Similar builder inventory problems occurred around the 1973–74 recession, the 1981–82 recession, the 1991 Gulf War recession, and the 2008–09 financial crisis.
In each case, the broader economy eventually experienced a significant rise in unemployment.
That doesn’t guarantee the same outcome today. But it makes the homebuilder data difficult to ignore. The historical comparison shows just how unusual today’s inventory buildup has become. New-home months of supply has moved above 9.0 months, a level that has appeared only during a handful of major economic downturns over the last six decades.

Why Builder Inventory Could Be an Economic Warning
When builders struggle this badly, they often aren’t the only economically sensitive industry experiencing pressure.
Housing touches construction, manufacturing, banking, transportation, building materials, appliances, and numerous other industries. Weakness can therefore spread well beyond homebuilding.
What’s unusual about the current cycle is how long this housing downturn has persisted without a broader U.S. recession.
One explanation is that other parts of the economy have remained unusually strong. Rising financial markets have supported household wealth, while enormous investment in artificial intelligence and data-center infrastructure has helped sustain capital spending.
But those forces don’t make the housing signal irrelevant.
Builder behavior today is beginning to resemble what happened before and during the previous housing downturn.
And nowhere is that more obvious than in prices.
Homebuilders Have Already Cut Prices by Nearly 15%
Median new-home sale prices peaked around $460,000 in 2022.
They have since fallen to approximately $393,000.
That’s a decline of nearly 15%.
For comparison, during the previous housing crash, median builder prices peaked around $262,000 in 2007 before declining to roughly $204,000 by 2010.
That represented a peak-to-trough decline of approximately 22%. The comparison with the last housing downturn is becoming increasingly striking. New-home prices have fallen from roughly $460,000 at the 2022 peak to about $394,000 in July 2026, meaning builders have already experienced a substantial portion of the nominal price correction seen after the previous housing bubble.

So, measured strictly by median sale price, the current builder correction has already traveled roughly two-thirds as far as the decline following the last housing bubble.
And the headline price decline doesn’t tell the entire story.
Mortgage Rate Buydowns Are Hiding Bigger Price Cuts
Builders have another weapon they didn’t use nearly as aggressively during previous cycles: mortgage-rate buydowns.
Instead of reducing the sticker price by another $30,000 or $40,000, a builder can subsidize the buyer’s financing.
That can dramatically reduce the monthly payment while allowing the builder to preserve a higher recorded sale price.
Major builders have leaned heavily into this strategy.
Lennar has been offering incentives equivalent to roughly 12.9%, while D.R. Horton has offered incentives around 10%, according to the figures cited in the underlying analysis.
Some promotions have included mortgage rates around 3.99% fixed for 30 years at a time when prevailing market mortgage rates are closer to 6.5%.
That’s an enormous difference.
And these aren’t theoretical incentives. Builder financing arms have advertised mortgage rates far below prevailing market rates, sometimes alongside thousands of dollars in additional closing-cost assistance.

It also means the official 15% decline in median builder prices may understate how much builders have actually conceded economically to get homes sold.
Include financing incentives, closing-cost assistance, and other concessions, and one could argue that the effective adjustment is already approaching, or potentially exceeding, the previous cycle’s headline price decline in some transactions.
And all of this is happening while unemployment remains below 4.5%.
That raises an uncomfortable question:
What happens to builder inventory and prices if unemployment actually rises?
Smaller Homes Don’t Explain the Entire Price Decline
There’s another common explanation for falling new-home prices: builders are simply constructing smaller houses.
There is some truth to that.
Builders have reduced floor plans as they attempt to produce homes at prices buyers can afford. But shrinking houses don’t explain the entire decline.
The more revealing measurement is price per square foot.
Median new-home pricing reached approximately $201 per square foot in 2024. Using updated Census square-footage data, that figure is now around $180 per square foot.
That’s roughly a 10% decline.
That price-per-square-foot decline is important because it strips away much of the effect of builders simply constructing smaller homes. Even after accounting for size, buyers are paying materially less for new construction than they were at the peak.

With a median sale price around $393,000 and median new-home size near 2,185 square feet, builders are clearly reducing the underlying price buyers pay for housing, not merely selling smaller houses.
During the previous housing cycle, the price per square foot ultimately fell by roughly 21%.
So there could still be considerable room for adjustment if demand remains weak.
Why Is Housing So Unaffordable Despite Historically Normal Rates?
The bigger affordability problem hasn’t disappeared.
Americans remain deeply pessimistic about housing, and prospective buyer traffic at builder communities is reportedly near some of the weakest levels since the 2008–09 downturn.
Mortgage rates certainly hurt.
But a 6.5% mortgage rate isn’t historically extraordinary. What is extraordinary is the price buyers must finance at that rate.
That’s why the builder correction matters.
For years, affordability could only meaningfully improve through some combination of lower mortgage rates, higher incomes, or lower home prices.
Builders are increasingly delivering the third option.
Builder Price Cuts Could Finally Restore Affordability
Nine-plus months of new-home supply is not a healthy signal for homebuilders.
Historically, this elevated inventory has appeared around some of America’s most significant economic downturns. That makes the current trend worth watching closely, particularly if labor-market conditions begin deteriorating.
But what’s bad for builders can ultimately become good for buyers.
Prices have already fallen nearly 15% from their peak, price per square foot is down about 10%, and aggressive mortgage-rate buydowns are pushing effective purchase costs even lower.
The adjustment still isn’t enough to make housing broadly affordable.
But it’s finally moving in the direction buyers need.
And if new-home inventory remains above nine months while demand stays near recessionary levels, builders could face increasing pressure to make the one adjustment the housing market has resisted for years: Lower prices even further.