Why Albany, New York Is Now the 2nd Hottest U.S. Housing Market. Inventory Is 50% Below Normal

 August 11, 2026
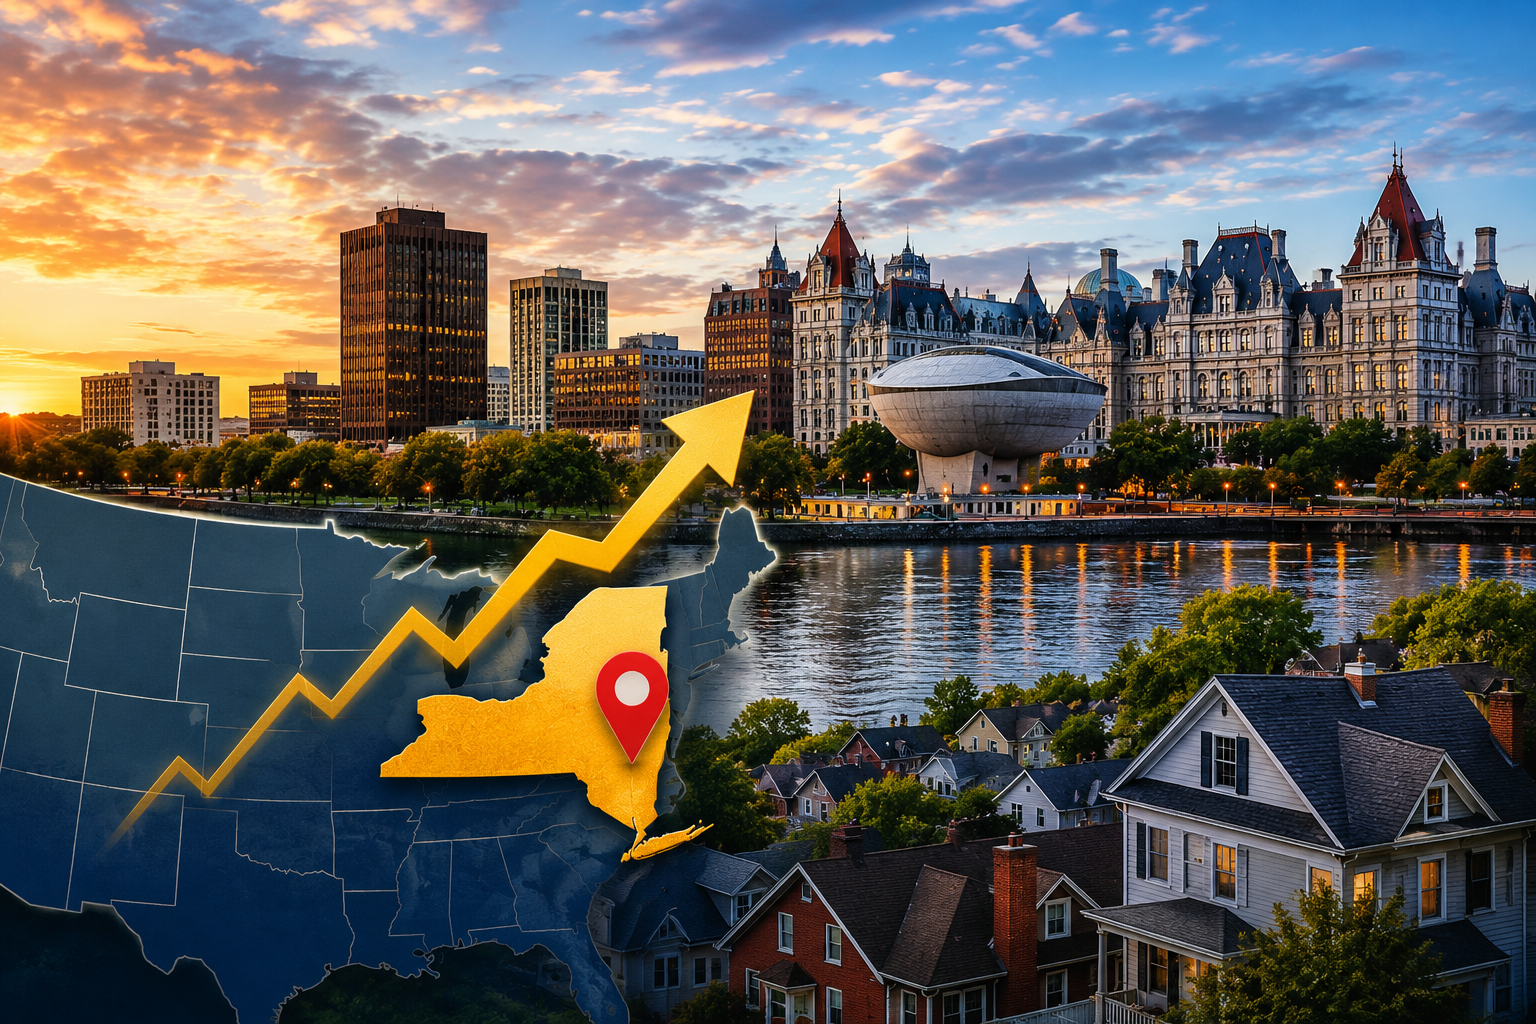
The 2nd Hottest U.S. Housing Market is not in Florida, Texas, or California. It is Albany, New York, where home values have risen 5.5% year-over-year despite high mortgage rates and weak housing demand nationally.
The biggest reason is supply. Albany would typically have around 4,000 homes for sale in July. In July 2026, buyers have only about 1,500 listings to choose from, leaving inventory roughly 50% below normal.
But Albany is not an isolated case. Syracuse, Rochester, Poughkeepsie, and Buffalo have also ranked among the strongest U.S. metros for home price growth in 2026. After years of Sun Belt dominance, America’s housing boom appears to be moving north.
And Albany has another surprising tailwind: a metro that historically lost residents to domestic migration is now gaining them.
Why Albany, NY Became the 2nd Hottest U.S. Housing Market
Upstate New York has emerged as one of the strongest housing regions in America.
Syracuse, Rochester, Poughkeepsie and Buffalo have all ranked among the top markets for home value growth through mid-2026. Albany is now near the top of the list, with values increasing approximately 5.5% over the last year.
That puts Albany second among U.S. metros with more than 500,000 residents.
The national rankings show just how concentrated the housing boom has become in the Northeast. Albany ranks second with 5.5% annual home value growth, while Syracuse takes the top spot at 6.6%. Bridgeport, Hartford, New Haven, Rochester, Poughkeepsie and Buffalo also appear in the top 10.

Compare that performance with many pandemic-era Sun Belt boomtowns, where inventory has surged, and home prices have stagnated or declined.
Albany has the opposite problem.
There simply aren’t enough homes for sale.
Albany Housing Inventory Remains 50% Below Normal
Before the pandemic, the Albany metro typically had around 4,000 homes listed for sale in July.
Today, that number is closer to 1,500.
The longer-term inventory trend makes the shortage even clearer. Albany had roughly 3,700 active listings in 2019, before supply collapsed during the pandemic. Although inventory has begun recovering from its 2023 low, the roughly 1,500 homes available in 2026 remain nowhere near pre-pandemic levels.

Inventory has increased somewhat compared with last year, but the market remains dramatically undersupplied compared with historical norms.
That shortage is important because home prices are determined by the balance between buyers and sellers.
Albany doesn’t need explosive population growth to push prices higher. It only needs enough buyers competing for a severely restricted number of listings.
Seller behavior is making that shortage worse.
Many homeowners refinanced or purchased properties when mortgage rates were near historic lows. Selling today could mean giving up a 3% mortgage and taking out a new loan at a significantly higher rate.
That mortgage rate lock-in effect has discouraged existing homeowners from listing.
The result is a market where relatively stable demand continues competing against unusually low supply.
Albany is part of a much broader reversal, with Upstate New York now outperforming much of the U.S. housing market as limited inventory and improving migration support home values.
Home Prices Are Rising Across the Albany Metro
The appreciation isn’t concentrated in one trendy neighborhood or county.
Home values are rising across much of the metro:
- Rensselaer County: +6.3%
- Saratoga County: +5.6%
- Schenectady County: +5.5%
- Albany County: +4.6%
Mapping those numbers shows that this isn’t simply an Albany city phenomenon. Appreciation extends throughout the surrounding metro, with Rensselaer County leading at 6.3% and neighboring Saratoga and Schenectady counties both exceeding 5%.

That broad-based appreciation suggests the supply shortage is affecting much of the region.
In certain neighborhoods, historically low inventory is still producing bidding wars even as buyers elsewhere in America gain negotiating leverage.
That’s particularly notable because Albany has rarely been considered a traditional housing boomtown.
Albany Is Gaining Residents After Decades of Migration Losses
For much of the last three decades, Albany struggled to attract domestic migrants.
The metro routinely lost around 2,000 to 4,000 residents per year through domestic migration from the 1990s into the 2010s.
Then the pandemic changed the pattern.
Remote work, affordability pressures in larger coastal cities, and shifting household preferences gave Albany a migration boost. Unlike some pandemic-era migration trends, Albany appears to have retained much of that improvement.
Domestic migration reached approximately +2,300 people in 2025, the third-highest figure since 1991.
That’s a major reversal from Albany’s historical trend.
The historical migration data puts that reversal into perspective. Albany spent much of the 1990s and 2010s losing residents domestically, including annual losses that exceeded 6,000 people during the 1990s. The recent shift back into positive territory represents a meaningful change from the metro’s long-term pattern.

But some perspective is important.
The Albany metro has roughly 915,000 residents, meaning 2,300 additional domestic migrants represent growth of only around 0.3%.
That’s nowhere near the migration rates experienced by Sun Belt boomtowns during the pandemic.
Yet Albany doesn’t need Sun Belt-level population growth to create housing pressure.
The Hottest U.S. Housing Market Does Not Need Boomtown Growth
Albany builds relatively little housing and has exceptionally low existing-home inventory.
That means even modest migration can have an outsized effect.
Imagine a market adding thousands of new residents while simultaneously having thousands fewer homes available for sale than it historically did. It doesn’t take enormous population growth to create competition.
That’s essentially what is happening in Albany.
The composition of that migration is also beginning to change.
Historically, Albany attracted people relocating from other parts of New York, particularly households moving north from the New York City area.
Now, migration from much farther away is beginning to appear.
Californians Are Starting to Move to Albany
One particularly interesting development is migration from California.
People from California are now relocating to the Albany metro in numbers that would have been unusual historically.
Those households can arrive with incomes, savings, and home equity accumulated in substantially more expensive housing markets.
A home that appears expensive to a longtime Albany resident may look relatively affordable to someone accustomed to California housing costs.
Some newcomers also increasingly view Upstate New York as a potential climate haven.
The region has relatively low exposure to several natural disasters affecting other parts of the country, while its colder climate could become less severe if temperatures continue warming over the longer term.
Migration from California remains small relative to Albany’s total population. But in a housing market with only around 1,500 listings, even incremental increases in higher-income demand can matter.
Albany Housing Has Historically Been Remarkably Stable
Another factor attracting buyers and investors is Albany’s long-term housing stability.
The metro has historically avoided the extreme boom-and-bust cycles experienced in markets such as Phoenix, Las Vegas, and parts of Florida.
Even during the 2008-09 housing downturn, Albany home values declined only around 10%.
Albany’s long-term home value history illustrates that resilience. Prices experienced a relatively modest decline and an extended period of stagnation after the previous housing downturn rather than a severe crash. The bigger change came after 2020, when limited inventory and stronger demand sent values sharply higher.

Historically, the pattern has been different.
Prices rise during periods of stronger demand, then tend to stabilize rather than experience dramatic crashes.
That doesn’t guarantee Albany will avoid future declines. But its combination of limited construction, constrained existing inventory and relatively stable employment has historically reduced housing volatility.
Albany also benefits from an economic base that differs from many boomtowns.
State government provides a substantial employment anchor, while universities, healthcare and expanding semiconductor manufacturing provide additional sources of demand.
Those industries can create a more stable employment environment than markets dependent heavily on tourism, construction or highly cyclical sectors.
High Property Taxes Are Albany’s Biggest Housing Drawback
Albany isn’t without major affordability challenges.
Property taxes are particularly high.
Reventure estimates Albany’s effective property tax rate at approximately 1.81% of market value, producing an average annual property tax bill of roughly $6,900 for new buyers. And Albany isn’t alone. High property taxes extend across much of Upstate New York, creating a significant additional housing expense that buyers need to account for when comparing the region with lower-tax Sun Belt markets.

That’s a significant expense on top of today’s elevated mortgage payments.
And as home prices continue appreciating, affordability could eventually become a larger constraint on demand.
A market can only outperform for so long before higher prices begin eliminating the affordability advantage that initially attracted buyers.
That’s one of the key risks to monitor going forward.
Can One of the Hottest U.S. Housing Markets Keep Rising in 2027?
For now, Reventure expects Albany to remain near the top of U.S. housing appreciation rankings through the remainder of 2026 and into 2027.
The underlying equation remains favorable for sellers.
Inventory is roughly 50% below normal. Migration has turned positive after decades of losses. Home price appreciation remains broad-based across surrounding counties, while government, universities and semiconductor investment provide relatively stable employment.
Eventually, more inventory or deteriorating affordability could slow the market.
But neither appears strong enough yet to fundamentally change Albany’s housing trajectory.
That’s why buyers shouldn’t simply assume that housing weakness in Florida, Texas or other Sun Belt markets applies everywhere.
Real estate remains hyperlocal. And that difference between markets is why national housing trends only tell part of the story. Buyers need to evaluate the forecast, valuation, inventory and price trends in the specific ZIP code where they are considering purchasing.

Before purchasing, check Reventure’s 1-Year Price Forecast for your ZIP code to see where prices are projected to move and how your local market compares with historical fundamentals.
Albany’s rise toward the top of America’s housing rankings illustrates how dramatically the market has shifted since the pandemic.
The housing boom hasn’t disappeared. It has moved north.