Top 10 Cities Where Zillow Says Home Values Went Up the Most Last Month
 August 22, 2025

Home prices are shifting, and some cities are pulling ahead. Zillow’s latest data shows where values climbed the most last month, revealing markets that are heating up despite higher borrowing costs. From affordable Midwest metros to pricey coastal hubs, the trend highlights both opportunity and pressure for buyers and sellers.
Here’s a breakdown of the ten U.S. cities with the strongest year-over-year home value gains and what’s driving demand in each.
Top 10 Cities with the Highest Home Values
Zillow’s latest figures highlight where prices climbed the most last month. From affordable Midwest cities to expensive coastal hubs, the trend shows both opportunity and pressure points for buyers. Here’s a closer look at the ten metros where values stand the highest in the latest report.
1. Cleveland, OH – 4.4%
Cleveland tops this list with steady momentum. The average home value sits at $247,131, up 4.40% year over year. While still one of the more affordable markets, the pace of growth signals renewed demand. The city’s mix of revitalized neighborhoods and solid employment in healthcare and education is keeping buyers active.
2. Hartford, CT – 4.2%
Hartford is moving up. The average home costs $391,749. Prices rose 4.2% in a year. That’s no small climb. Hartford sits between Boston and New York, and that matters. Easy access to both cities makes it appealing. Yet, life here is calmer. More space. More charm.
3. Rochester, NY – 4.1%
Rochester is rising too. Home values hit $274,993. Growth reached 4.1%. Why? Jobs and stability. Universities and hospitals keep demand steady. Families see it as affordable compared to New York City. First-time buyers also find their opening here. Rochester is cheaper, but not standing still.
4. Louisville/Jefferson County, KY – 4.1%
Louisville holds steady. The average value is $271,986, and growth is 4.1%. The city balances work and play. It’s a logistics hub, but also a cultural spot. Young buyers are coming. The population is ticking up. Prices follow the flow. If you want affordability with energy, Louisville is worth a look.
5. New York, NY – 4.0%
New York is in a league of its own. A typical home runs $712,393. Growth still came in at 4.0%. That’s huge given the high base. Space is tight, demand is global. Rentals stay hot, so buyers keep competing. Yes, it’s expensive. But New York doesn’t slow down.
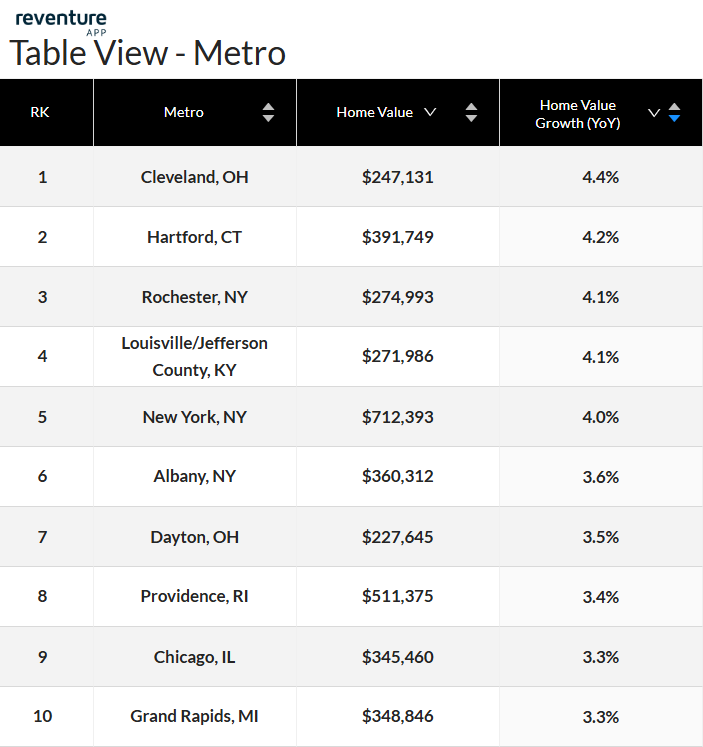
Cleveland, OH, has the highest home value growth YoY in 2025, reaching 4.40%. Access the above table here. [Link]
6. Albany, NY – 3.6%
Albany’s numbers climbed too. Homes now cost $360,312. That’s a 3.6% rise. As the state capital, jobs are steady. The economy holds firm. People here get more space than in the city. Yet urban life isn’t far away. Albany gives both room to breathe and city access.
7. Dayton, OH – 3.5%
Dayton’s market is smaller but resilient. Homes are valued at $227,645, with a 3.50% increase year over year. The metro continues to attract attention thanks to its affordability. Revitalization downtown and strong healthcare employers are helping push values upward.
8. Providence, RI – 3.4%
Providence stays attractive. The average home value reached $511,375, and growth reached 3.4%. It’s coastal, historic, and artistic. Universities keep people coming. Boston is nearby, too. Buyers see lifestyle and investment together. That’s why demand keeps ticking up.
9. Chicago, IL – 3.3%
Chicago’s vast housing market continues to inch higher. The typical home is now worth $345,460, up 3.30%. The city’s scale, job opportunities, and cultural variety keep buyers interested. While higher inventory levels bring balance, steady demand is still pushing prices upward.
10. Grand Rapids, MI – 3.3%
Grand Rapids is growing. Homes are worth $348,846. Prices rose 3.3%. The city blends industry and innovation. Manufacturing roots remain. But healthcare and tech are rising fast. Families and young professionals are moving in. The community feels strong. Affordability adds fuel.
Want to dig deeper than city averages? Reventure App offers home value data all the way down to the ZIP code for just $39/ month. You can see which neighborhoods are undervalued. You can spot where prices are heating up. Sellers can check if their listing matches the market. Buyers can time a move better. To find more about home value trends, Reventure puts the data right in your hands.