Orlando, FL Sees 29.7% Price Cuts on 5,064 Homes for Sale Out of the Total Inventory of 17,016 in 2025
 March 6, 2025

Orlando, FL, is experiencing significant price reductions in its housing market in 2025, with 29.7% of listings seeing price cuts. According to recent data available on Reventure App, 5,064 homes for sale have been discounted out of a total inventory of 17,016. This trend suggests a shift in the metro’s market dynamics influenced by rising interest rates and changing buyer demand. For homebuyers, this presents an opportunity to secure deals, while sellers need to adjust pricing strategies to stay competitive in the evolving market.
Orlando, FL’s Price Cut % Over the Years
According to the data available on Reventure App, Orlando, FL’s price cut % has fluctuated significantly over the years. Before the pandemic (2017 to 2019), the price cut percentage showed a fluctuating but overall declining trend. It stood at 25.5% in 2017, peaked at 28.8% in 2018, and then dropped to 22.4% in 2019. This period reflected a relatively stable housing market where price reductions were moderating as demand remained steady, with sellers having to make fewer adjustments to attract buyers.
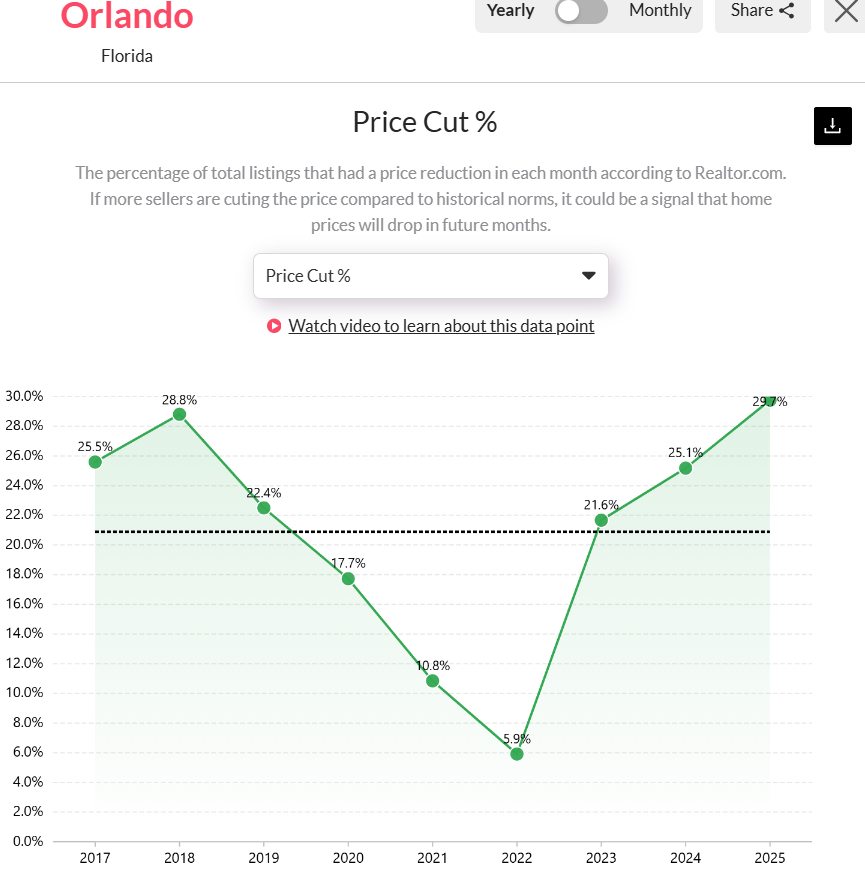
Orlando’s price cut % increased to 29.7% in 2025, indicating a worsening situation compared to 2024. Access the Price cut % chart of Orlando, FL here. [Link]
During the pandemic (2020-2022), price cuts dropped dramatically, hitting a historic low. The percentage fell to 17.7% in 2020, 10.8% in 2021, and reached its lowest point at 5.9% in 2022. This was primarily driven by record-low mortgage rates and heightened housing demand, leading to rising home prices and fewer sellers needing to cut prices.
After the pandemic (2023-2025), Orlando’s housing market saw a sharp reversal. Price cuts rebounded to 21.6% in 2023, climbed to 25.1% in 2024, and peaked at 29.7% in 2025. This increase suggests a shift toward a buyer’s market, with rising mortgage rates and affordability concerns forcing sellers to reduce prices more frequently to attract buyers.
Price Cut % Trend in Counties of Orlando, FL
The Orlando, FL metro area, including Seminole, Orange, Lake, and Osceola counties, is experiencing varying levels of price cuts % in 2025. Seminole County leads with the highest price cut percentage at 36.3%, followed by Lake County at 34.3%, Orange County at 29.2%, and Osceola County at 24.1%. These figures suggest a notable market correction, with sellers adjusting listing prices to attract buyers. Moreover, the home value growth remains minimal, with Lake and Orange counties seeing 0.3% growth, while Seminole (0.1%) and Osceola (-1.2%) indicate stagnation or decline.
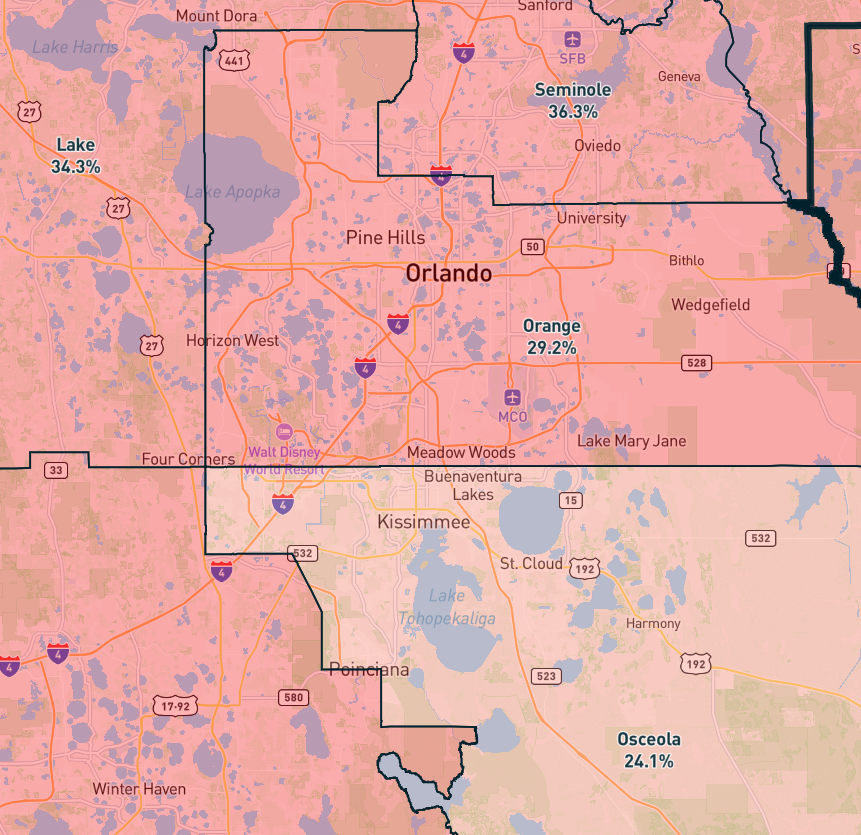
Seminole County experienced the highest price cut of 36.3% in 2025. Access the above price cut % map here. [Link]
The overvaluation percentage also varies, with Seminole at 30.8%, Lake at 17.7%, Orange at 17.5%, and Osceola at 7.8%, showing that some counties still have homes priced above their intrinsic value. The value-to-income ratios hover around 4.2 to 4.9, reflecting affordability concerns. With Orange County having the largest population (1.47M), demand dynamics will further shape future trends.
Orlando, FL’s Housing Market Predictions for 2025
Orlando’s housing market is projected to decline further in 2025, with a home price forecast score of 34 out of 100, indicating reduced buyer demand. It is important to note that a score below the range of 45 – 51 on Reventure App suggests a declining market with a downward tilt. This score also indicates that in the short term, there will likely be more decline in home prices and an increase in homes for sale with longer days on the market.
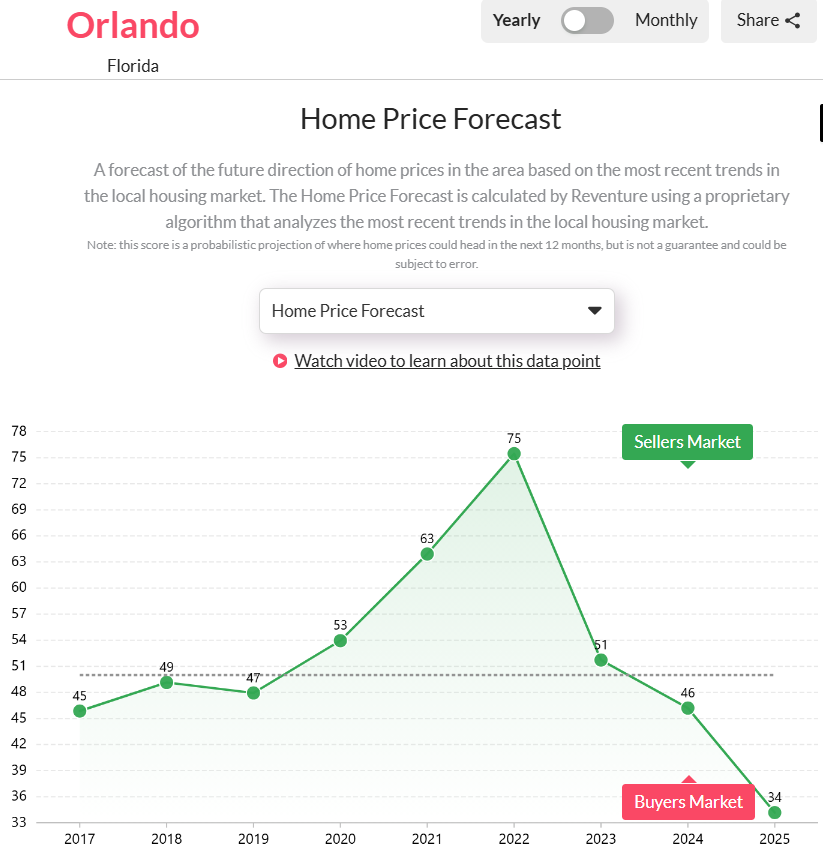
Orlando, FL’s Home price forecast score reached 34 in 2025. Access the home price forecast score chart here. [Link]
Moreover, with inventory rising and price reductions increasing, sellers will likely face more challenges in attracting buyers. Currently, Orlando’s DOM metric has reached 40 days, which suggests slower sales and more room for negotiation. If this trend continues, home prices will see further declines in 2025, making it an opportune time for buyers looking for deals. If you want a detailed analysis of the Orlando, FL metro area, explore the housing market data at the ZIP-code level on Reventure App.


One Response