

The Orlando, FL housing market has taken a sharp turn in 2025, marking its first year of negative growth since the Great Recession. With home values declining across all major counties, Seminole, Orange, Lake, and Osceola, the metro is now firmly in a buyer’s market.
Based on the latest insights from the Reventure App, this article explores Orlando’s current real estate landscape, price cuts, inventory shifts, and predictions for 2026.
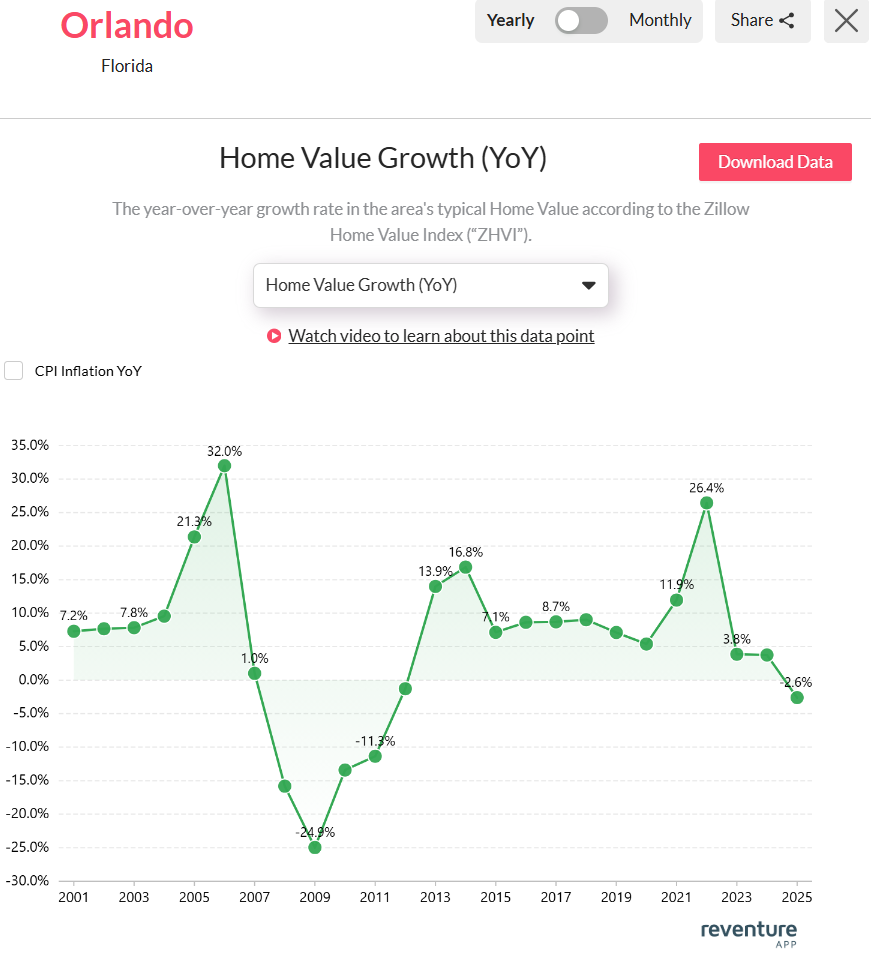
Orlando, FL’s Home Value Growth YoY Dropped to -2.6% in 2025
According to data available on Reventure App, the Orlando housing market experienced a year-over-year home value decline of -2.6% in 2025. This marks the first negative growth rate since the 2008–2011 housing crash, when the market saw dramatic declines of -24.9% in 2009 and -11.3% in 2010.
Following a strong post-pandemic surge of 26.4% in 2022, home value appreciation slowed considerably to 3.8% in 2023, eventually turning negative by 2025. This cooling trend reflects a broader national shift influenced by higher interest rates, affordability concerns, and changing buyer demand.
Orlando, FL’s home value growth dropped to -2.6% in 2025. Access the home value YoY growth graph of the metro here. [Link]
Historically, Orlando has seen large swings in home value growth. For example, prices soared by 32.0% in 2006 before plunging during the Great Recession. In contrast, the market showed moderate but steady growth from 2012 to 2019, ranging from 7.1% to 13.9%.
The current downturn may indicate a market correction after the unsustainable growth of recent years, raising questions for investors and homeowners alike about what’s next for Orlando’s real estate market.
Housing Market Trends in the Counties of Orlando, FL in 2025
According to data available on Reventure App, all four key counties of the Orlando metro, Seminole, Orange, Lake, and Osceola, experienced negative home value growth in 2025, indicating a region-wide market cooldown.
Seminole County recorded a year-over-year decline of -2.6%, with the highest price cut rate in the metro at 35.9%. Homes here are staying on the market for an average of just 58 days, the shortest among the four counties, indicating faster turnover despite falling prices. It also has the highest overvaluation rate at 27.8%.

Orange has the highest sales inventory (5,836) in the Orlando, FL, metro area. Access the above map here. [Link]
Orange County, the most populous in the metro area with 1.47 million residents, saw a -2.3% drop in home values. Price cuts were reported in 33.2% of listings, and the average days on market stood at 65.
Lake County posted a -1.6% decline in values, but price reductions were the most frequent at 35.6%. Homes took an average of 71 days to sell. Osceola County had the steepest drop of -3.5%. Listings took 85 days to sell, the slowest pace in the metro, and only 24.9% featured price cuts.
Orlando, FL’s Housing Market Predictions for 2025 – 2026
The Orlando, FL, housing market is projected to decline severely throughout 2025–2026. According to the Reventure App, the Home Price Forecast Score for the metro stands at just 29 out of 100, indicating that it is now a completely buyers’ market. On Reventure App, a score below 45 denotes a declining market, 45–55 suggests stability and scores above 55 reflect appreciation.
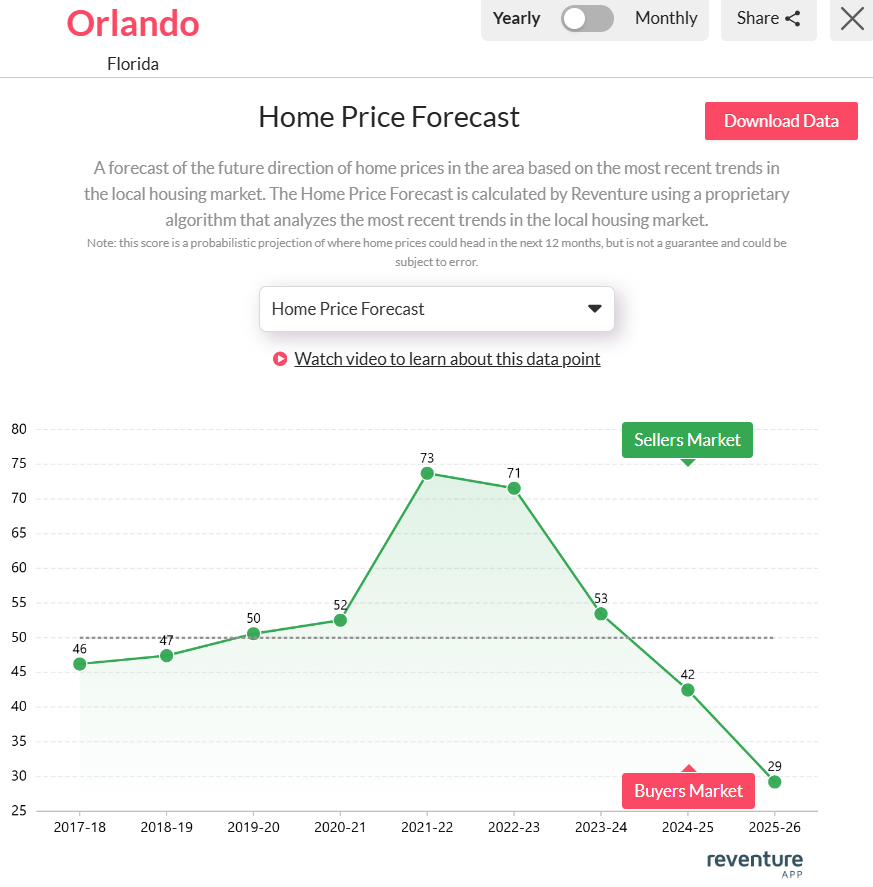
Orlando, FL’s Home price forecast score reached 29/ 100 in 2025. Access the home price forecast score chart here. [Link]
The steep drop from a peak score of 73 in 2021–22 to only 29 by 2025–26 highlights extreme cooling in the market and highly reduced buyers’ demand. This downturn suggests more negotiating power for buyers, while sellers must price competitively and stay flexible to close deals. Both homeowners and investors should prepare for further weakening and reassess their strategies in this evolving market situation.
For buyers, sellers, and investors navigating Orlando’s shifting market, timing and insight are everything. With Reventure’s premium plan for just $39/month, you gain access to state, metro, county, and ZIP code–level forecasts on inventory, pricing, value trends, and market strength. Whether you’re planning to buy smart, sell competitively, or track future moves, Reventure delivers the local data edge you need to stay ahead.
Access Housing Market data for Florida and All Other U.S. States on Reventure App.
{
“@context”: “https://schema.org”,
“@type”: “Article”,
“mainEntityOfPage”: {
“@type”: “WebPage”,
“@id”: “https://reventureapp.blog/orlando-fl-housing-market-update-in-2025/”
},
“headline”: “Orlando, FL Housing Market Update in 2025”,
“image”: “https://reventureapp.blog/wp-content/uploads/2025/07/Orlando-FL-Housing-Market-Update-in-2025.jpg”,
“author”: {
“@type”: “Organization”,
“name”: “”,
“url”: “https://reventureapp.blog/author/reventure-data/”
},
“publisher”: {
“@type”: “Organization”,
“name”: “”,
“logo”: {
“@type”: “ImageObject”,
“url”: “”
}
},
“datePublished”: “”
}


