Myrtle Beach, SC Home Value Growth YoY Dropped to -2.5% as the Price Cuts Increased to 27.8% in 2025
 June 19, 2025

The Myrtle Beach housing market is showing clear signs of a downturn in 2025, with year-over-year home value growth falling to -2.5%. This marks a notable shift from recent years of appreciation. At the same time, price cuts have become more common, rising to 27.8% of all listings, indicating that sellers are adjusting their expectations in response to softer demand.
As the market resets, both buyers and sellers must adapt to these changing dynamics. Let’s take a closer look at what’s driving the Myrtle Beach real estate trends in 2025:
Myrtle Beach, SC Home Value Growth YoY Analysis Over the Years
In 2025, the typical home value in the Myrtle Beach-Conway-North Myrtle Beach metro area sits at $341,400, slightly down from its 2024 peak. After a rapid rise post-2020, where values jumped from around $225K in 2021 to over $327K in 2023, the market appears to be leveling off. This plateau reflects both affordability pressures and waning demand.

Myrtle Beach, SC’s home value growth dropped to -2.5% in 2025. Access the home value YoY growth graph of the metro here. [Link]
According to the data on Reventure App, Year-over-year growth has turned negative, dropping to -2.5% in 2025. This marks a sharp reversal from the 27.2% growth peak just two years prior in 2023. The decline indicates that the explosive appreciation seen during the pandemic-fueled housing boom is cooling significantly, suggesting market stabilization or even mild correction.
Price cuts are rising sharply, reaching 27.8% of listings in 2025, up from just 4.8% in 2021. This growing trend indicates increased seller competition and pricing fatigue among buyers. Sellers are adjusting expectations as longer listing periods and higher inventory shift negotiating power toward buyers.
Inventory Trend in Horry County of Myrtle Beach, SC in 2025
Horry County, home to Myrtle Beach, is experiencing notable housing market shifts in 2025. The year-over-year home value growth has dropped to -3.3%, indicating price depreciation after years of accelerated gains. This decline aligns with broader regional cooling trends and reflects reduced buyer demand and affordability challenges.
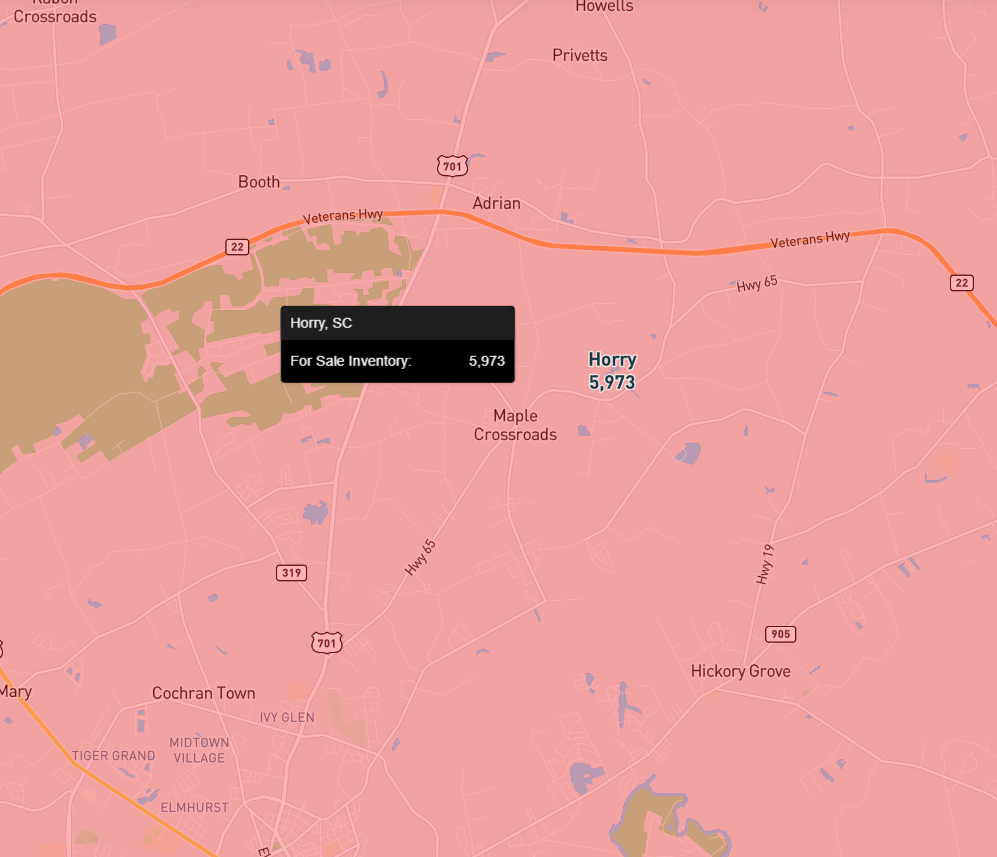
Horry, SC’s inventory increased to 5,973 in 2025. Access the above inventory map of Horry County here. [Link]
The for-sale inventory stands at 5,973 homes, indicating a saturated market. With more listings and slower movement, sellers face mounting pressure to adjust pricing and expectations. Moreover, 4.1% of homes are currently overvalued, which, while modest, suggests some homes are still priced above what current market conditions can support.
The value-to-income ratio is 4.4, a relatively high figure indicating potential affordability issues for local residents. It implies that median home values are more than four times the median household income, which can limit new buyer entry.
With a population of 397,478, Horry County remains a significant coastal housing market. However, its cooling trend highlights a shift toward more balanced or even buyer-favorable conditions.
Myrtle Beach, SC’s Housing Market Predictions for 2025 – 2026
The Myrtle Beach housing market is projected to decline further in 2025–2026. According to the Reventure App, the Home Price Forecast Score for the Myrtle Beach-Conway-North Myrtle Beach metro has dropped to 35 out of 100, clearly indicating a buyers/cooling market. On Reventure App, a score below 45 denotes a declining market, 45–55 suggests stability, and scores above 55 reflect appreciation.
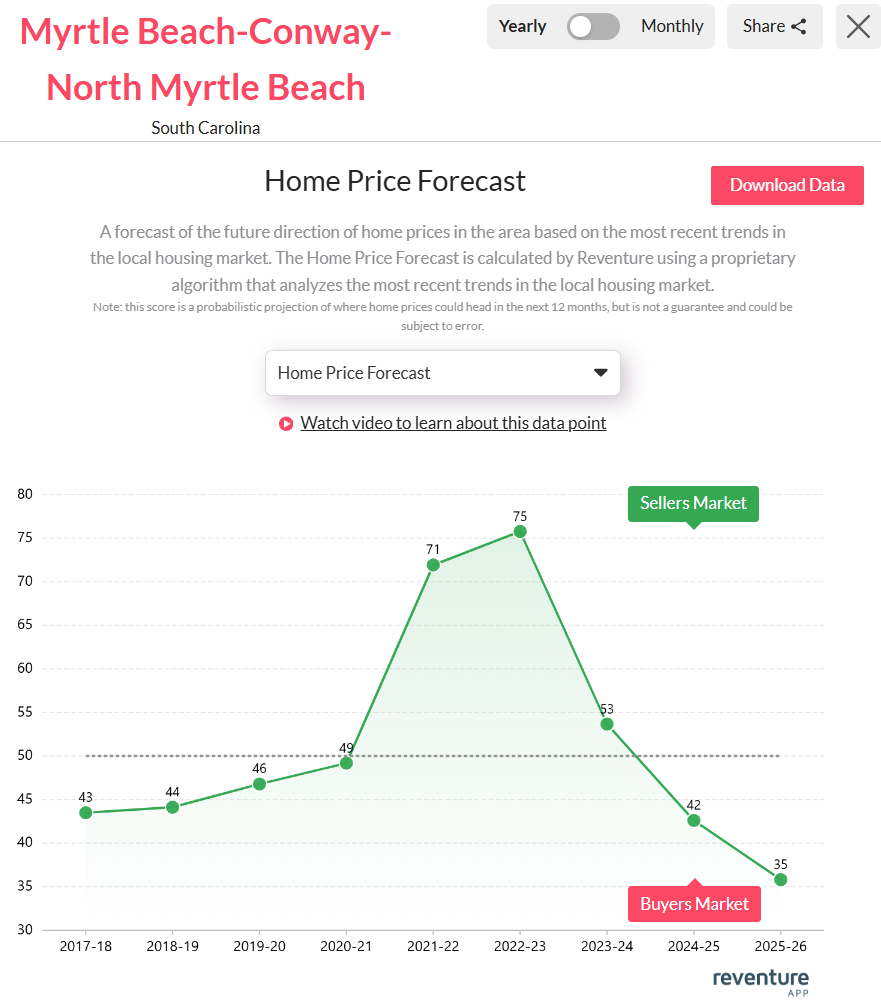
Myrtle Beach, SC’s Home price forecast score reached 35/ 100 in 2025. Access the home price forecast score chart here. [Link]
The sharp drop from 75 (a peak sellers market score in 2022–23) to 35 within just three years underscores the ongoing correction in home prices and demand. This weakening market forecast implies more negotiating leverage for buyers, while sellers must adapt quickly with competitive pricing and flexible terms. Homeowners and investors should expect continued softening and evaluate their strategies carefully in this shifting situation.
For buyers and sellers trying to make sense of Myrtle Beach’s shifting market situation, timing is everything. That’s where Reventure’s premium plan can help. For just $39 per month, you can access detailed, ZIP code–level home price forecasts powered by real-time market data. Whether you’re looking to buy smart, sell strategically, or simply monitor trends, Reventure gives you the tools to stay one step ahead.
Access Housing Market data for South Carolina and All Other U.S. States on Reventure App.
{
“@context”: “https://schema.org”,
“@type”: “Article”,
“mainEntityOfPage”: {
“@type”: “WebPage”,
“@id”: “https://reventureapp.blog/myrtle-beach-sc-home-value-growth-yoy-analysis-2025/”
},
“headline”: “Myrtle Beach, SC Home Value Growth YoY Dropped to -2.5% as the Price Cuts Increased to 27.8% in 2025”,
“image”: “https://reventureapp.blog/wp-content/uploads/2025/06/Myrtle-Beach-SC-Home-Value-Growth-YoY-Analysis-2025.jpg”,
“author”: {
“@type”: “Organization”,
“name”: “”,
“url”: “https://reventureapp.blog/author/reventure-data/”
},
“publisher”: {
“@type”: “Organization”,
“name”: “”,
“logo”: {
“@type”: “ImageObject”,
“url”: “”
}
},
“datePublished”: “”
}


