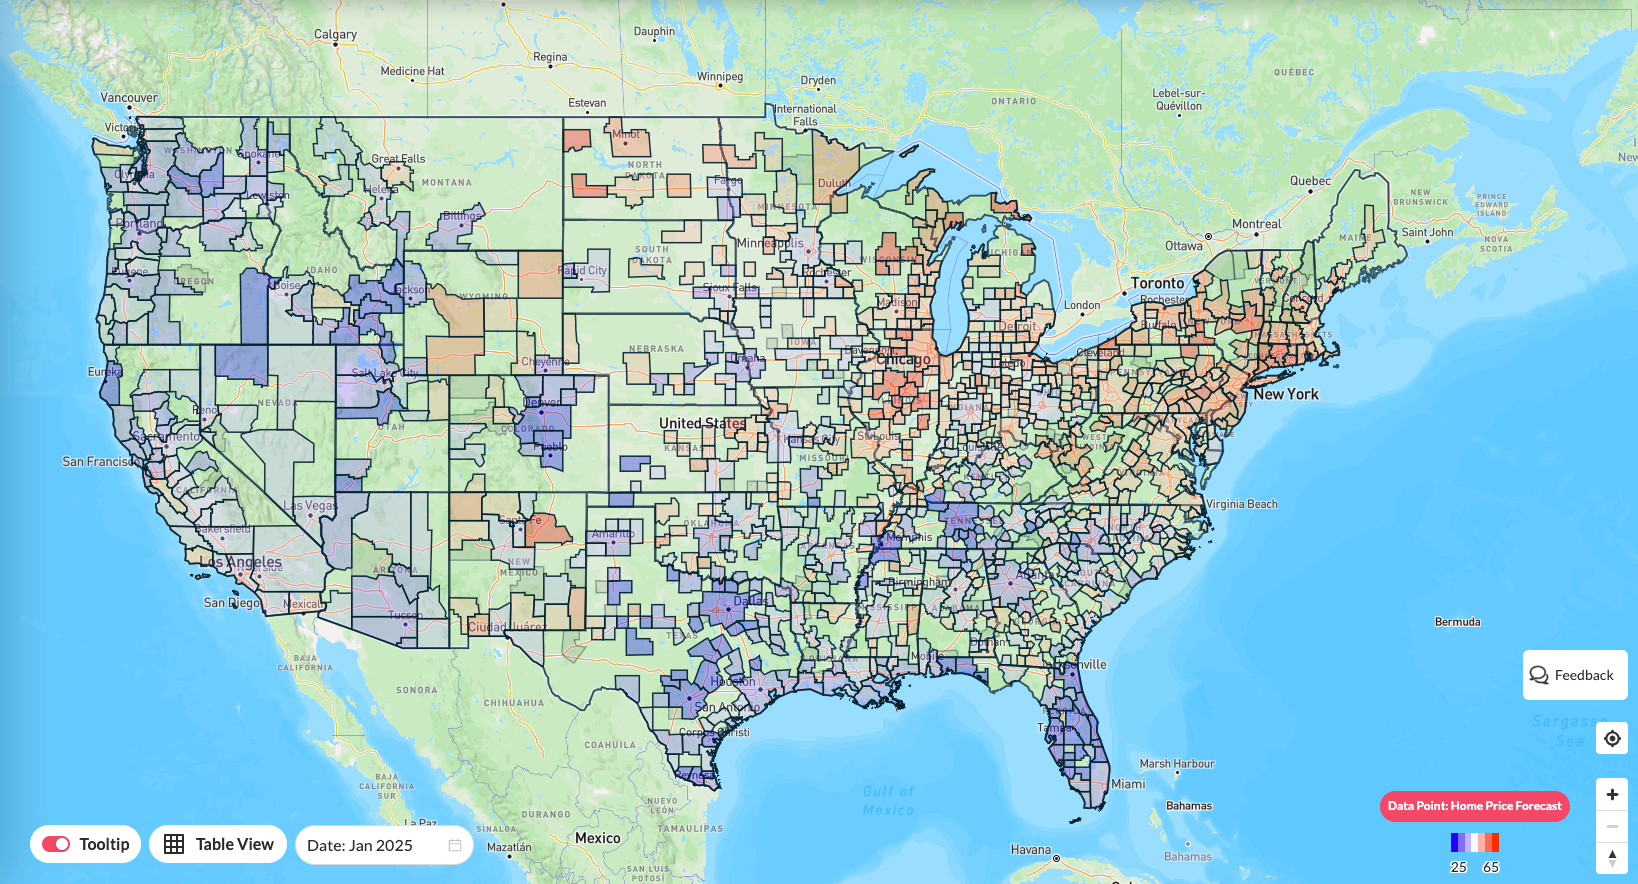
Kansas City, MO’s housing market enters 2025 with rising price cuts, reflecting a stable yet cooling market nearing a potential decline. According to the data on Reventure App, 13.9% of homes for sale in Kansas City, MO had their prices reduced in late 2024. This means 1,146 homes out of 8,221 were listed with lower prices. This figure highlights an increase in the price cuts compared to the 2023 rate of 12%.
Kansas City, MO Price Cut % Analysis
Before the pandemic, Kansas City, MO’s real estate market saw significant fluctuations in price cuts. In 2017, 14.8% of homes experienced price reductions, peaking at 17.2% in 2018 as buyer demand softened. This period reflected a declining market trend with reduced buyer demand and increased sellers, leading to longer days on the market and more frequent price cuts. In 2019, the Price Cut % dropped to 11.6%, indicating slight stabilization before the pandemic.
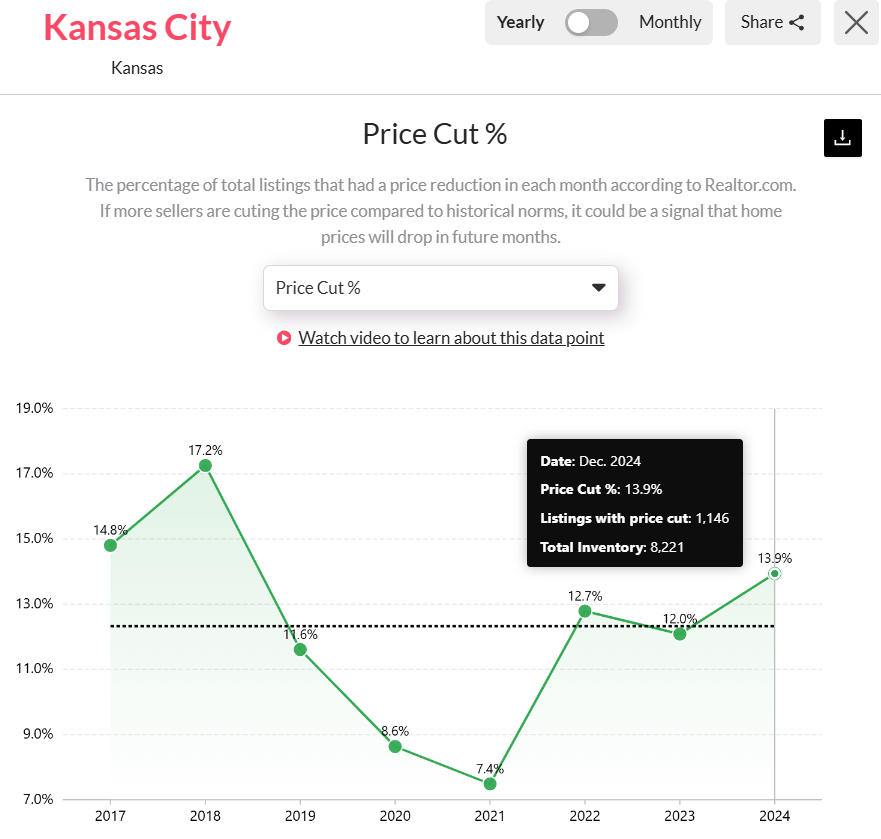
Kansas City, MO’s real estate market experienced considerable shifts in price adjustments. Access the price cut % graph of Kansas City, MO here. [Link]
During the pandemic and its aftermath, price-cut trends evolved as market dynamics shifted. In 2020, the rate fell further to 8.6% and bottomed out at 7.4% in 2021, driven by heightened buyer demand and limited homes for sale. However, as the market cooled post-pandemic, price cuts began rising again reaching 12.7% in 2022 and 13.9% in late 2024.
Price Cut % Trend in Different Counties of Kansas City, MO
The Kansas City, MO metro area displays varied Price Cut % trends across its counties. Buchanan County had the highest price cut rate at 21.0%, followed by Franklin County with 24.0% which indicates a significant number of homes facing reductions in these regions. The impact of price cuts is seen more prominently in some counties, such as Carroll County (20.6%) and Ray County (15.9%). These areas reflect a greater need for price reductions, possibly due to reduced buyer demand, longer days on the market, and a higher supply of homes.

Access the DOM map of Kansas City’s Counties on Reventure App. [Link]
On the other hand, counties like Caldwell and Livingston show minimal price cuts of 0.0%, suggesting a more stable or potentially more competitive market. Areas like Wyandotte and Jackson counties report price cuts of 19.0% and 16.8%, respectively which indicate a moderate decline in home prices.
The overall metro area is seeing more price adjustments as the market adjusts to post-pandemic conditions, signaling a declining market with more sellers, higher inventory, and prolonged time on the market. As more counties experience price cuts, we can expect further pressure on home prices in the Kansas City metro area, potentially indicating future declines in home values.
Kansas City, MO Housing Market Predictions for 2025
The Kansas City, MO housing market is projected to remain stable with a downward tilt in 2025, as reflected by a home price forecast score of 47 out of 100 on the Reventure App. This score indicates that the market is leaning towards a cooling phase but has not yet entered a full decline. According to Reventure’s framework, a score below 45 denotes a declining market, 45-55 signals stability, and above 55 suggests an appreciating market.
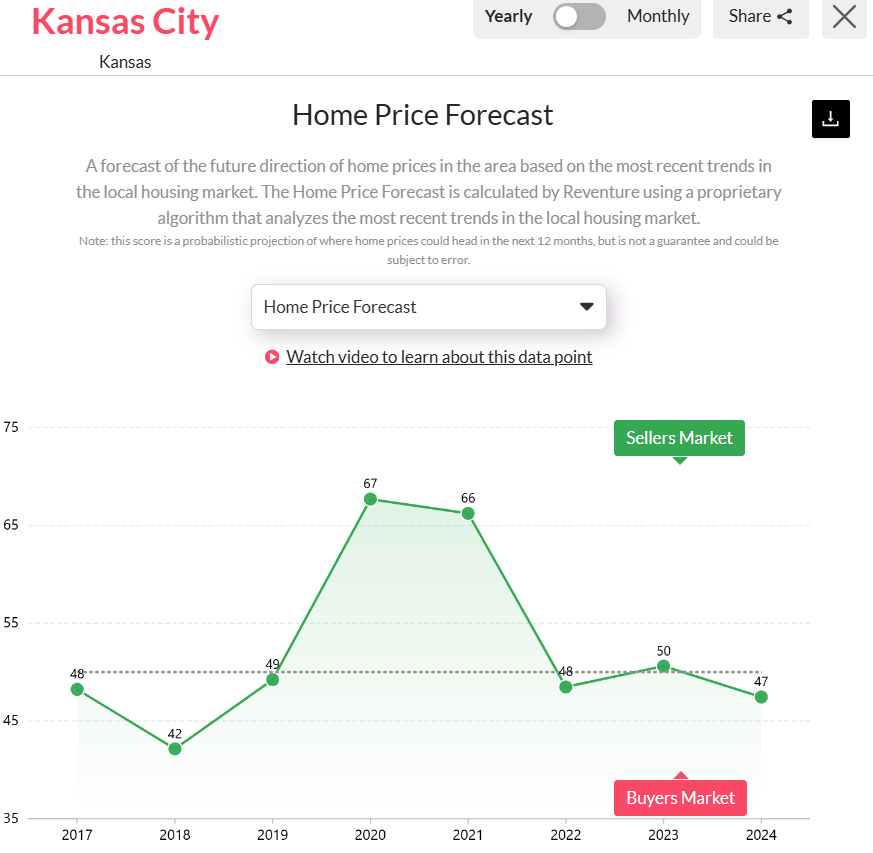
Kansas City’s housing market is offering more opportunities for buyers due to decreased demand. Access the home price forecast score chart of the Kansas City Metro here. [Link]
With a score of 47, Kansas City’s housing market is experiencing reduced buyer demand, an increase in active sellers, and longer days on the market. These trends are likely to lead to more price cuts, signaling reduced competition and the potential for future home price declines. While the market remains stable for now, it is edging closer to a declining phase, reflecting a gradual shift in market dynamics. If you want a more in-depth analysis of the Kansas City, MO metro area, explore the housing market data at the ZIP-code level on Reventure App.