How the Federal Reserve’s Rate Moves Are Reshaping the U.S. Housing Market
 October 28, 2025
The Federal Reserve’s rate moves are quietly reshaping the U.S. housing market. After years of soaring prices and bidding wars, momentum is slowing. Mortgage rates are shifting with every policy, and affordability has become the new battleground.
Homeowners are holding onto their low-rate mortgages, keeping supply tight. Moreover, builders are cautious, and buyers are waiting for clarity. The market isn’t crashing; it’s adjusting.
What was once a frenzy is turning into a test of patience. And now every decision from the Fed ripples through open houses, loan offices, and kitchen-table plans across America. Let’s discuss more about it:
1. The Cost of Borrowing Has Doubled
The Federal Reserve’s rate hikes have pushed mortgage payments to historic highs. In 2019, a typical U.S. homebuyer paid about $1,234 per month. By 2023, that figure had jumped to $2,462, before slightly easing to $2,304 in 2025.
The surge came as interest rates climbed, making each borrowed dollar more expensive. Even though home prices began to level off, higher financing costs kept monthly payments heavy. Therefore, many potential buyers stayed on the sidelines, unable to meet stricter affordability limits.
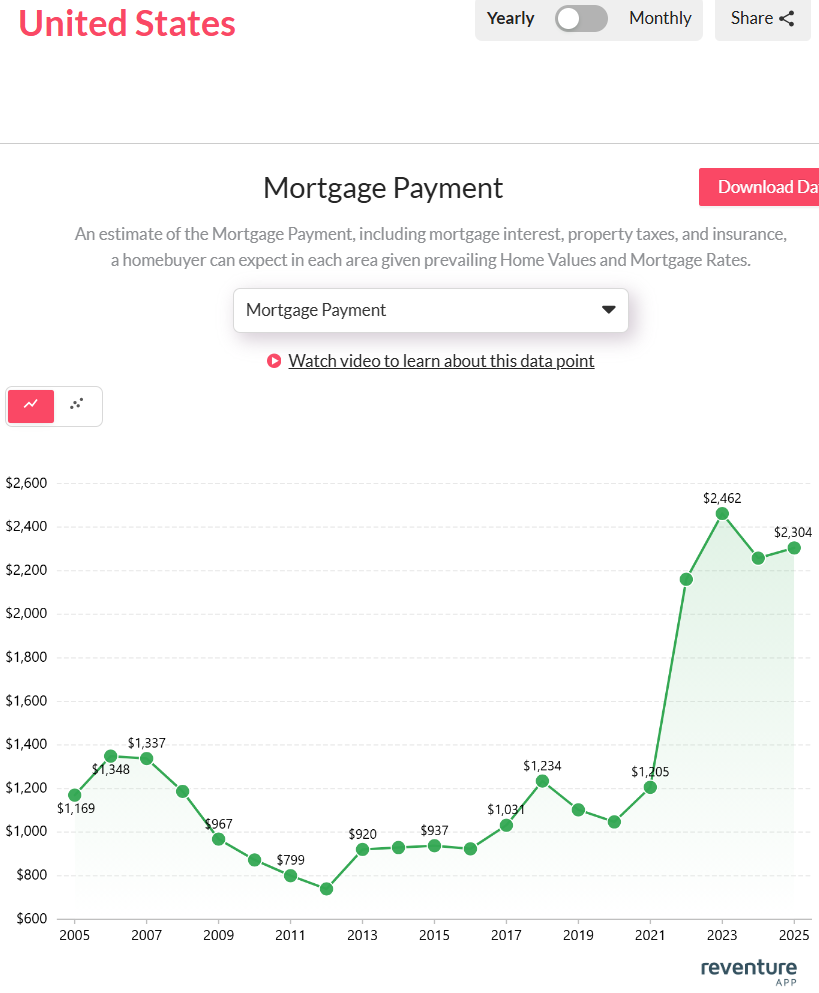
Monthly mortgage costs have nearly tripled since 2020, staying above $2,300 even after rate cuts. Access the above graph here. [Link]
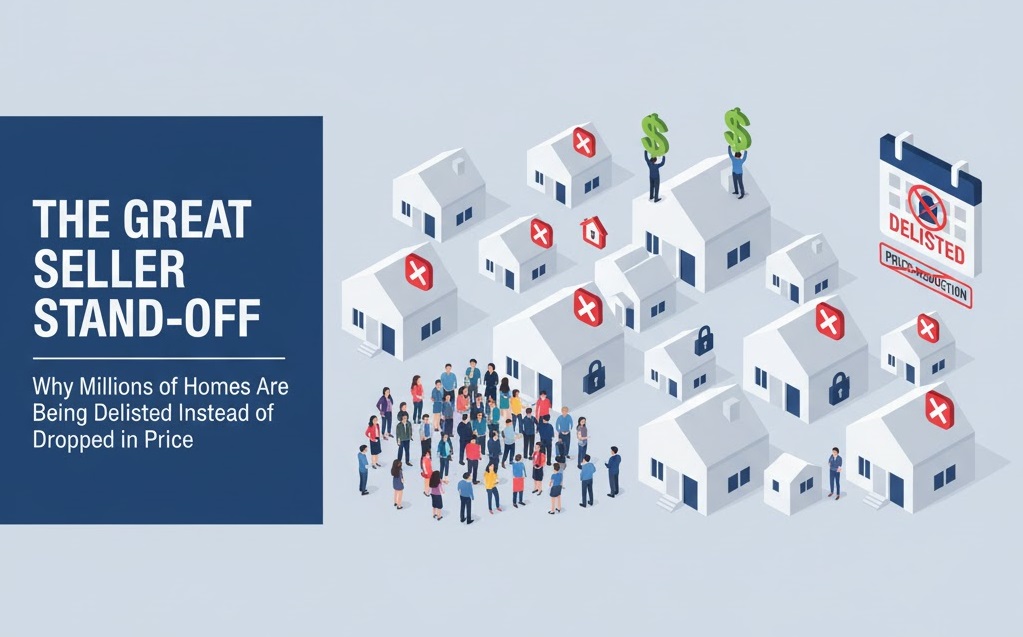
Moreover, households locked into ultra-low pandemic-era loans are hesitant to sell. This ‘rate lock’ effect keeps many homes off the market, slowing mobility and keeping supply tight. As a result, affordability remains stretched, even as rates begin to cool.
The Fed’s gradual shift toward lower rates may bring partial relief, but the scars of high borrowing costs will linger. Buyers who entered the market at peak rates are now facing some of the highest mortgage burdens in two decades.
2. The Income Gap Widens
The story of affordability deepens when comparing wages with the income required to buy a home. In 2011, a household needed around $31,998 to afford a typical U.S. home. By 2025, that figure soared to $92,195, nearly triple. During the same period, median household income rose far more slowly, hovering around $70,000.

Homeownership now demands a $92,000 income, far beyond the median household earnings. Access the above graph here. [Link]
Therefore, the gap between what people earn and what they need to buy has widened dramatically. In 2023, the required salary even touched $98,499, marking the highest affordability strain since 2005.
Moreover, this mismatch shows why even with solid employment, millions of Americans remain priced out. The Fed’s rate decisions ripple through this gap. Every percentage change in borrowing costs reshapes who can qualify for a home loan and who cannot.
3. Inventory Makes a Comeback
After years of tight supply, inventory is finally returning. In 2021, the number of homes for sale fell to just 578,075, the lowest in recent memory. Builders couldn’t keep up, and many owners stayed put to protect their cheap mortgages. However, by 2025, listings have climbed to 1.1 million, nearly doubling in four years.
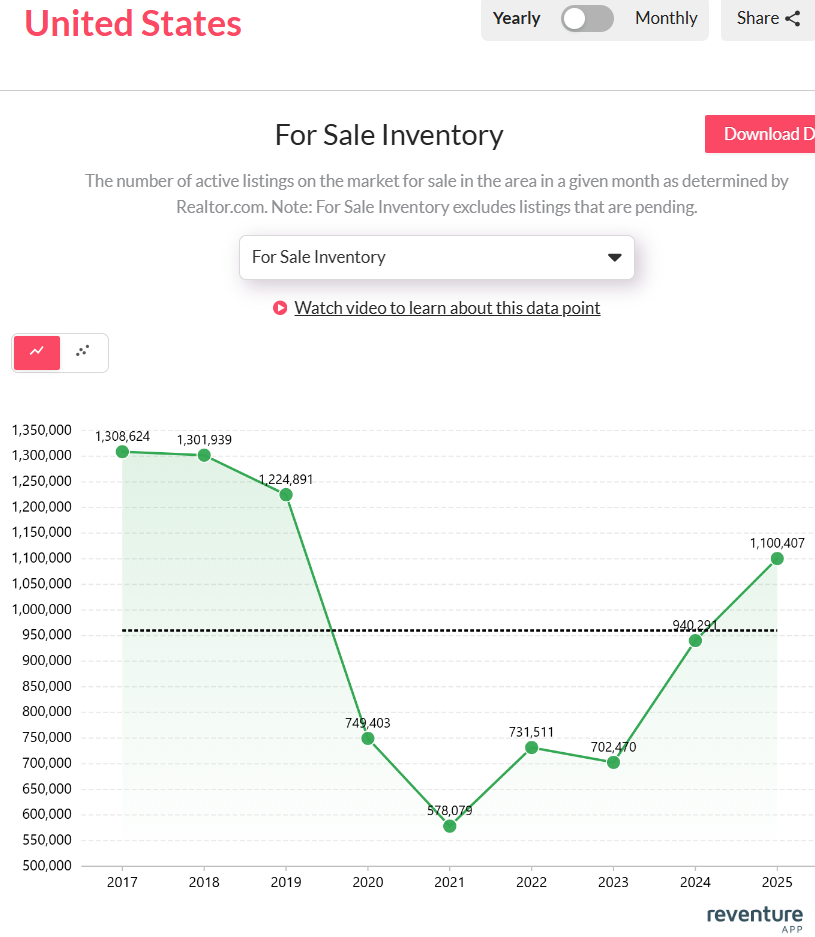
U.S. housing supply rebounds to 1.1 million listings, easing years of tight inventory. Access the above graph here. [Link]
This rebound brings balance to a market long dominated by sellers. Therefore, more options mean slower price growth and room for buyers to negotiate. Moreover, if the Fed’s easing continues, mobility may rise further as locked-in homeowners finally re-enter the market. Still, inventory remains below pre-2019 levels, suggesting a full recovery will take time. But the trend points toward stability rather than scarcity.
Final Thoughts
The Fed’s rate moves have changed the rhythm of the U.S. housing market. Mortgage costs are high, incomes lag behind, and inventory is slowly improving. The frenzy is over, replaced by patience and caution. As rates ease, balance may return. Affordability must recover, and confidence must rebuild. The next phase won’t be a boom but it could be steady and sustainable.
If you want to see your state, metro, or county’s housing situation, buy Reventure Premium. For just $49 a month, you can access 40+ data points, from mortgage-to-income ratios to home values and inventory growth. And it offers 6x more accurate forecasts than Zillow. Because in a market that’s holding tighter than ever, precision isn’t a luxury.