Analyzing the Housing Markets with the Most Inventory entering Fall 2025
 September 2, 2025

Inventory levels in the U.S. housing market are climbing as we move into fall 2025. More homes are on the market, and that is putting pressure on prices.
In cities with the most supply, values are already falling. Tampa, Austin, Dallas, Phoenix, San Antonio, and Denver stand out. Sellers in these markets face heavy competition. Many are cutting prices and accepting below-market offers to get deals done.
For homebuyers and investors, this shift creates opportunity. Targeting high-inventory neighborhoods is the smart move. That is where the best discounts are available heading into this season.
Let’s explore the data driving this trend:
What Does Inventory Really Mean?
We know that markets like Tampa, Austin, Dallas, Phoenix, San Antonio, and Denver have too many homes for sale. But how do we measure this “too many”?
The answer is Inventory Surplus/Deficit. This is a premium data point under Market Trends on Reventure App, sourced from Realtor.com. It compares how many homes are on the market versus what a balanced level should look like. A surplus means extra homes sitting unsold. A deficit means there are fewer homes than buyers want.
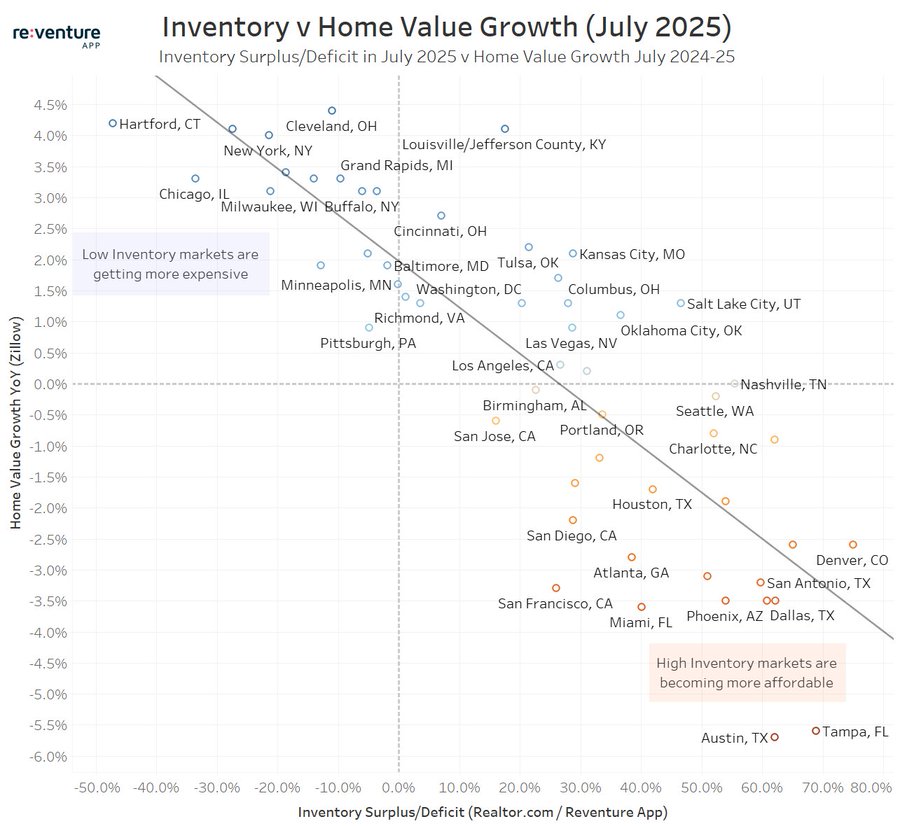
Tampa and Austin, are seeing prices fall, while low-inventory markets, like Chicago and New York, continue to get more expensive. Access the above graph here. [Link]
Now look at the chart above. You’ll see a clear story. Markets with a surplus of inventory are all on the right side. And nearly every one of them shows negative home value growth. Prices are dropping there.
On the left side, where inventory is low, it’s the opposite. Cities like Chicago, New York, and Hartford show strong price gains. Fewer homes mean buyers compete harder, and that drives values up.
This is why inventory explains almost everything about today’s market. It’s not a mystery. Too much supply brings prices down. Too little supply pushes them up. And right now, knowing which side your market is on makes all the difference.
Markets with Low Inventory and Rising Prices
Not every city is seeing falling prices. Some markets still have too few homes for sale. These are the low-inventory markets on the left side of the chart.
Chicago, New York, and Hartford stand out. Inventory is deeply negative in these metros. That means fewer homes are listed compared to what buyers need.
And look at the price growth. Hartford is up more than 4% year-over-year. New York and Chicago are each up about 3%. These gains are strong compared to the national average.
Other cities show the same pattern. Cleveland, Milwaukee, Buffalo, and Louisville all have deficits. Each one shows positive home value growth between 2% and 4%.
The story is simple. Low supply equals more competition. Buyers fight over the limited homes available. That drives values up. For buyers, these markets are tough. For sellers, they remain very profitable.
Markets with High Inventory and Falling Prices
Now, what happens when inventory shoots up? Prices fall. And they fall fast.
Look at Tampa, FL. It has the highest surplus, nearly 70% above normal levels. Prices there are down almost 6% year-over-year. Sellers are under pressure, and buyers have leverage.
Next is Austin, TX. Inventory is about 60% above normal. Home values are falling by around 5% YoY. This market has completely flipped from the boom days.
Dallas, TX and Phoenix, AZ each show surpluses near 40%. Prices are sliding between -3% and -4%. Both were hot growth markets just a few years ago, but supply has piled up.
San Antonio, TX, and Denver, CO are close behind. Each has inventory up by more than 30%. Both are seeing values fall by about -3%.
The trend is clear. High inventory equals falling prices. These metros are now the best places for buyers and investors to find deals. Sellers are cutting, negotiations are easier, and discounts are real.
For anyone waiting for affordability, these are the markets to watch heading into fall 2025.
To help make sense of these inventory and pricing shifts at a more granular level, go to Reventure App. It offers home value and inventory data all the way down to the ZIP code for just $49/ month. Localized insight from Reventure App empowers buyers to spot neighborhoods with the lowest pricing. It also helps sellers align with current market realities, making it easier to make smarter, better-timed decisions in a cooling, yet still competitive, housing market.