Delistings Surge: Why So Many Homes Are Getting Pulled Off the Market
 October 10, 2025

Delistings are back in the headlines. Across the U.S., more sellers are walking away. Not to a closing table. But off the market.
Realtor.com’s August 2025 monthly housing market trends report shows why. Inventory rose 20.9% year over year. Momentum cooled. New listings slowed. Pending sales fell 1.3%. Homes sat longer, i.e., 60 days, up seven. Price cuts hit 20.3%.
Then the kicker. Delistings jumped 57% year over year in July. One home was pulled for roughly every four new listings. In Miami, it was closer to one in two. That pressure changes leverage for buyers.
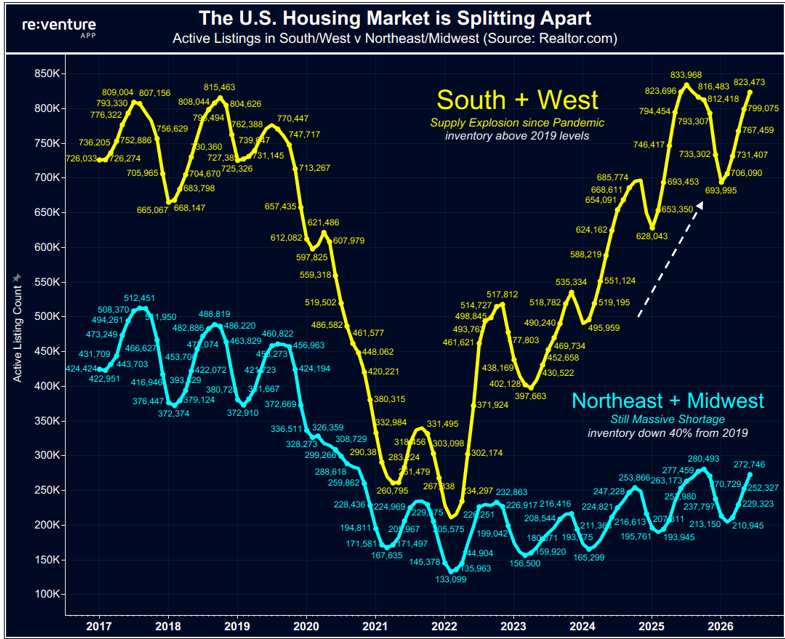
The market now sits near balance at five months of supply. But conditions are split by region. The South and West loosen. The Northeast and Midwest stay tight. That divergence fuels retreat. Sellers test the water. Don’t like the temperature. And yank the sign.
Now, let’s see what’s really happening with the number of homes for sale:
Inventory Growth Slows After a Two-Year Climb
After nearly two years of steady recovery, U.S. housing inventory is finally hitting resistance. Realtor’s data available on Reventure App shows 1.1 million homes for sale in September 2025, marking the fourth straight month above the one-million mark. That’s up from just 702,000 in 2023 and a pandemic low of 578,000 in 2021, but still short of the 1.3 million-plus listings seen before 2019.
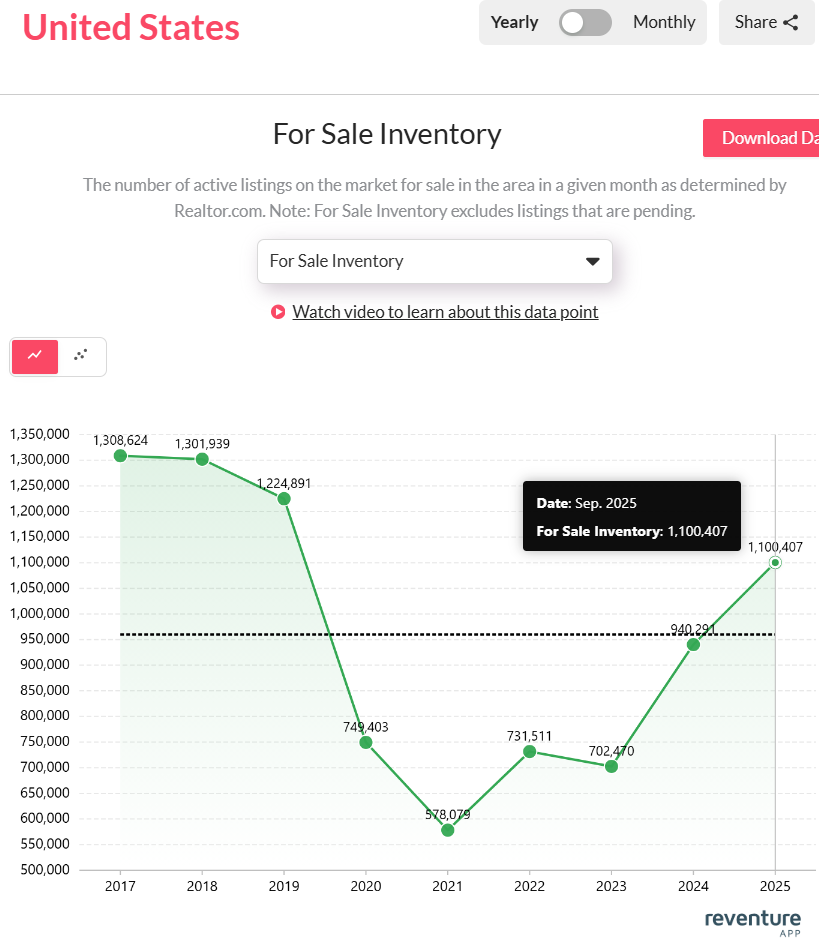
U.S. housing supply tops 1.1 million listings in 2025, which is the highest since the pandemic. Access the above graph here. [Link]
The year-over-year pace of growth is cooling. Inventory rose 17% YoY, a sharp slowdown from 33.8% in 2024 and 26.5% in 2022. The recovery that once looked like a comeback is now flattening out.
That shift explains a lot. More homes are available than at any time since the pandemic, yet buyers aren’t moving fast enough to clear them. The market isn’t collapsing. It’s catching its breath. And as listings level off, sellers are beginning to feel the drag of a slower cycle ahead.
Days on Market: Sales Are Taking Longer, Everywhere
Homes are staying on the market longer, a clear sign that momentum is fading. Reventure App data shows the median home now spends 62 days on the market, up sharply from 55 days in 2024 and just 41 days at the peak of 2021’s frenzy.

Homes now sit 62 days before selling, the slowest pace in six years. Access the above graph here. [Link]
That puts market speed back near 2018–2019 levels, when homes typically took around two months to sell. The year-over-year growth in market time is +11.8%, following last year’s +14.5% increase. It’s the third straight annual rise, underscoring a consistent cooling trend.
In short, homes are moving more slowly, buyers are taking their time, and sellers are waiting longer for offers. This shift matters because “time on market” is often the first place demand cracks show. When properties linger, inventory builds. When inventory builds, price cuts follow. The clock, once a seller’s friend, is now ticking in buyers’ favor.
Price Cuts Spread as Sellers Face a Tougher Market
The data shows 25% of active listings nationwide saw price cuts in 2025, up from 23.8% last year and nearly double the pandemic-era low of 14.3% in 2020. The share hasn’t been this high since 2022, when price reductions briefly peaked at 26.7%.

About 1 in 4 listings saw a price drop in 2025 as sellers adjusted to a cooling. Access the above graph here. [Link]
But not every state is feeling the same heat. The deepest price cuts are concentrated in the interior markets, where affordability is strained and inventory is rising fastest. Indiana leads with 34.2% of homes discounted, followed by Oregon (32.6%), Colorado (31.2%), and Arizona (30.4%). These are clear signs of sellers struggling to match buyer budgets.
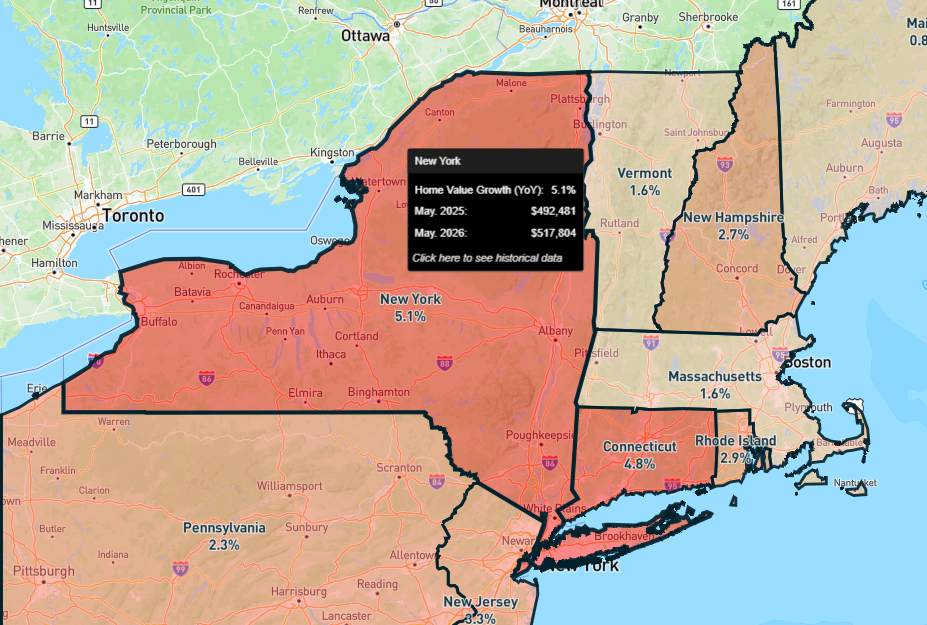
Meanwhile, the tightest markets, like New York (12.5%) and Hawaii (15.8%), remain insulated, reflecting persistent low supply and strong demand.
Final Words
Price resilience now depends less on national momentum and more on local conditions. The U.S. market is no longer moving in one direction. Instead, it’s fragmenting into clear winners and strugglers. That’s why it’s more important than ever for buyers and investors to pinpoint where to make their move and where to wait.
So, get yourself Reventure’s monthly premium subscription for only $49. It gives you six times more accurate forecasts than Zillow. And you will be able to unlock 40+ data points, from income-to-value ratios to inventory shifts and price projections. For anyone who wants to buy a house in the right place at the right time, that data could make all the difference.


One Response