

Austin’s once red-hot housing market is undergoing a noticeable shift in 2025. After years of rapid appreciation during the pandemic, home values are now falling, inventory is rising, and buyer demand is cooling. This article explores year-over-year home value changes, trends across key counties, and future price forecasts, using the latest insights from Reventure App to help buyers, sellers, and investors navigate this evolving market situation.
Home Value Growth YoY in Austin Dropped to -5.0% in 2025
Austin’s housing market entered a phase of contraction in 2025, with home values seeing a notable year-over-year decline. According to data available on Reventure App, the city’s typical home value growth dropped to -5.0%, marking a continued slowdown following last year’s decline of -1.1%.

Austin, TX’s home value growth dropped to -5.0% in 2025. Access the home value YoY growth graph of the metro here. [Link]
This downward trend follows the sharp reversal from the pandemic boom. Between 2020 and 2022, Austin’s home values surged, peaking with an impressive 28.8% year-over-year increase in 2022. However, the growth proved unsustainable as affordability constraints, rising mortgage rates, and weaker demand triggered a steep correction.
The current -5.0% decline in 2025 further solidifies Austin’s shift from a red-hot seller’s market to a more balanced and, in some areas, even buyer-friendly environment.
While this cooling may cause concern for short-term investors, it presents opportunities for prospective homebuyers who were previously priced out of the market. As inventory stabilizes and the market rebalances, industry watchers will be monitoring whether prices plateau or continue to adjust in the coming months.
Housing Market Trends in the Counties of Austin, TX in 2025
In 2025, counties across the Austin metro are reflecting a cooling housing market, with declining home values and increased price cuts. According to data available on Reventure App, Travis County, the core of the Austin metro, saw a -6.2% year-over-year drop in home values. Inventory remains high at 6,767 listings, and 36.1% of homes are undergoing price cuts, a clear indication of buyer hesitation.

Travis County in Austin has the highest for-sale inventory in Austin, TX in 2025. Access the above table here. [Link]
Williamson County, another major Austin suburb, experienced a -3.8% home value decline, with 37.4% of listings seeing price reductions. While affordability is relatively better here, with mortgage payments at 32.2% of income, prices are still under pressure. Hays County saw a sharper -5.4% drop, with price cuts affecting 33.4% of listings. Days on market rose to 50, indicating slower sales activity.
In Caldwell County, home values declined by -3.1%, and listings are staying on the market longer, averaging 71 days. Bastrop County posted a smaller drop of -1.8%, but with 38.6% of income now going toward mortgage payments, affordability is tightening. Overall, the Austin metro counties are transitioning to a more balanced, buyer-friendly market.
Austin, TX’s Housing Market Predictions for 2025 – 2026
The Austin housing market is projected to decline further in 2025–2026. According to the Reventure App, the Home Price Forecast Score for the metro stands at 28 out of 100, firmly placing it in a buyers’ market. On Reventure App, a score below 45 indicates a declining market, 45–55 suggests stability, and any score above 55 reflects appreciation.
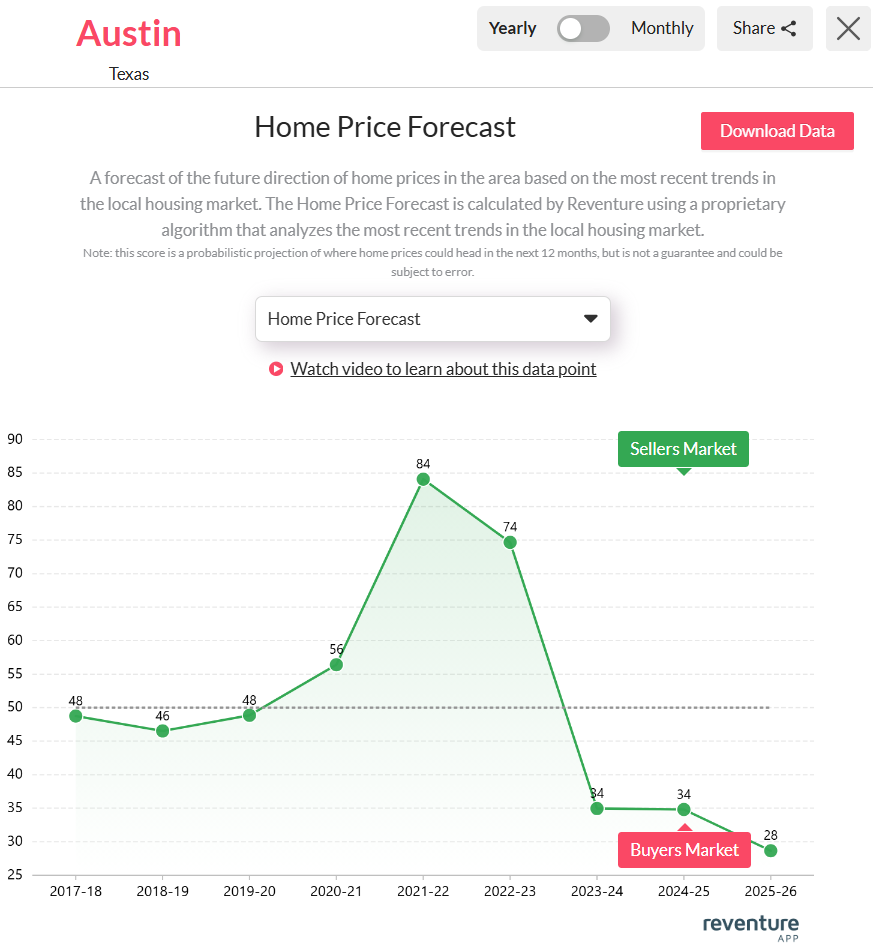
Austin, TX’s Home price forecast score reached 28/ 100 in 2025. Access the home price forecast score chart here. [Link]
This marks a sharp reversal from Austin’s pandemic-era highs. The score peaked at 84 in 2021–22, indicating a strong sellers’ market at the time. However, the forecast dropped dramatically to 34 in 2023–24, and is now down again to 28, reflecting reduced demand and increased market softness.
For buyers, sellers, and investors navigating Austin’s shifting market, timing and insight are everything. With Reventure’s premium plan for just $39/month, you gain access to state, metro, county, and ZIP code–level forecasts on inventory, pricing, value trends, and market strength. Whether you’re planning to buy smart, sell competitively, or track future moves, Reventure delivers the local data edge you need to stay ahead.
Access Housing Market data for Texas and All Other U.S. States on Reventure App.
{
“@context”: “https://schema.org”,
“@type”: “Article”,
“mainEntityOfPage”: {
“@type”: “WebPage”,
“@id”: “https://reventureapp.blog/austin-tx-housing-market-situation-in-2025/”
},
“headline”: “Austin, TX, Housing Market Situation in 2025”,
“image”: “https://reventureapp.blog/wp-content/uploads/2025/07/Austin-TX-Housing-Market-Situation-in-2025.jpg”,
“author”: {
“@type”: “Organization”,
“name”: “”,
“url”: “https://reventureapp.blog/author/reventure-data/”
},
“publisher”: {
“@type”: “Organization”,
“name”: “”,
“logo”: {
“@type”: “ImageObject”,
“url”: “”
}
},
“datePublished”: “”
}


