

The U.S. housing market feels different these days. Prices have climbed, mortgage rates remain high, and buyers are slowing down. Sellers wait longer for offers, and inventory is shifting in ways that are hard to track. Everyone wants answers, but clear trends are often hidden.
That’s where the new Reventure App feature comes in. You can now view national housing market data in one place. It lets you cycle through home values, inventory, and days on market with ease. Think of it as your quick guide to spotting where the market is heading before anyone else.
Why National Data Matters?
Most people used to track only local or metro data. That was useful, but it often gave a narrow view. You could see what was happening in your city, yet miss the bigger picture shaping it.
Now, with the national layer, the story changes. You can spot broad market shifts that move the entire country. It helps you compare your metro against national benchmarks. Is your city running hotter or cooler than the rest? That context is powerful.
For investors, policymakers, and serious buyers, this isn’t just extra data. It’s a cycle map. A way to see trends before they hit home.
Key Data Points Available
The new national feature on Reventure App includes all the same metrics you’re used to seeing at the state, metro, county, and zip levels. But for now, let’s look at some of the most important ones:
Home Value Growth
National home price growth has cooled dramatically. Back in 2021, the growth rate peaked at 18.3%, one of the fastest jumps in modern history. By 2023, that surge was gone. Growth fell to nearly 0%, showing how quickly the market turned.

U.S. home price growth peaked at 18.3% in 2021, but has since cooled to just 0.1% in 2025, showing the market’s dramatic slowdown. Access the above graph here. [Link]
In 2024, values bounced slightly at 2.9%, but as of 2025, the growth rate is just 0.1%. This tells you the frenzy is over. Buyers no longer face double-digit increases. Sellers, on the other hand, are entering a flat market where gains are harder to find.
Sales Inventory
The number of homes for sale reveals the other side. In 2017, inventory was over 1.3 million. Then it plunged, hitting just 534,649 homes in 2021. That shortage helped drive the historic price boom. Since then, supply has made a comeback.
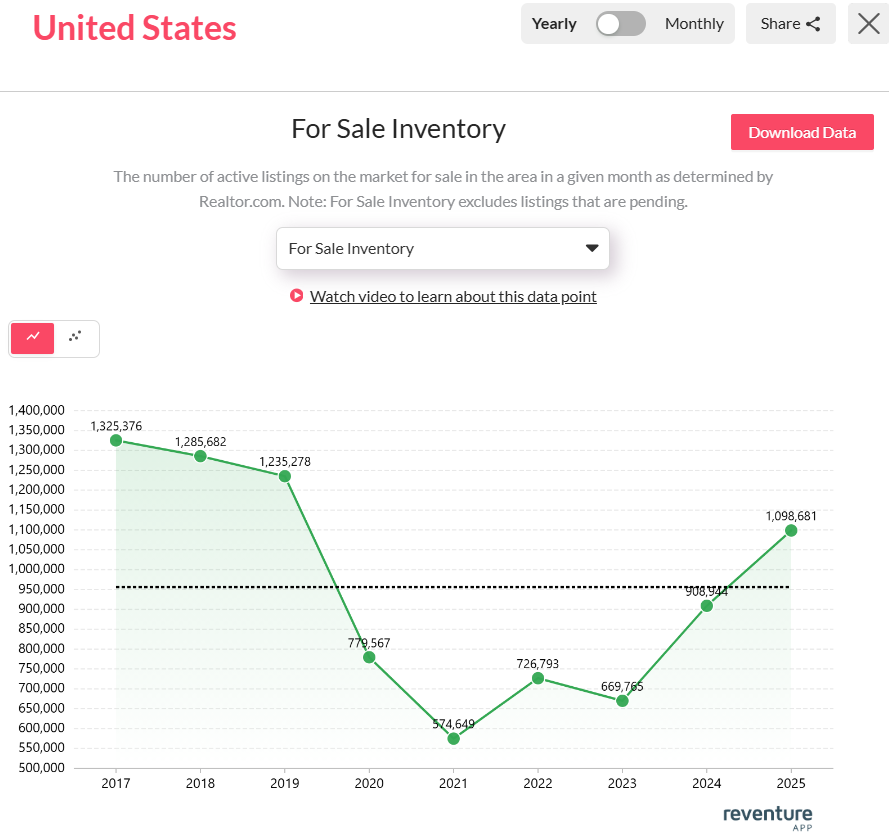
Housing inventory hit a low of 534,649 homes in 2021, but rebounded to over 1.09 million in 2025, giving buyers more options. Access the above graph here. [Link]
By 2024, listings were above 900,000. Now in 2025, inventory has risen to over 1.09 million homes. More options for buyers. More competition for sellers. This shift alone changes how deals are made.
Days on Market (DOM)
How long homes sit before selling is another clear sign. In 2017, the median was 61 days. By 2021, homes moved in just 37 days, the fastest pace in years. But things have slowed.

Homes sold in just 37 days in 2021, but by 2025, the average has stretched to 60 days, reflecting weaker demand. Access the above graph here. [Link]
In 2024, the number reached 53 days. Now in 2025, it’s back at 60 days, almost double the speed of the pandemic market. This shows demand has eased, and buyers have more room to negotiate.
How the U.S. Market Is Shifting?
The national data makes one thing clear. The housing market has slowed. Home value growth is no longer in double digits. After peaking at 18.3% in 2021, growth has collapsed to just 0.1% in 2025. That’s about as flat as it gets. Prices are holding, but the days of rapid appreciation are gone.
At the same time, inventory is building. From the record low of 534,649 homes in 2021, supply has climbed to over 1.09 million listings today. More homes on the market mean buyers finally have choices, while sellers face more competition.
The pace of sales confirms the shift. Houses that sold in just 37 days in 2021 are now taking around 60 days in 2025. This slowdown shows demand has cooled, affordability is stretched, and buyers are negotiating harder.
Put together, these indicate a national housing market leaving its boom years behind and entering a more balanced, cautious phase.
Final Takeaway
The new national feature on Reventure App gives you a clear window into where the housing market is heading. You can see home values flattening, inventory rising, and days on market stretching. And the best part is that all of it is in one place. It connects the dots that local data alone often misses.
For anyone planning to buy, sell, or invest, this broader view can make all the difference. It helps you time the market better and compare your area against the national trend. You can also spot shifts before they hit your neighborhood. With this update, Reventure App isn’t just tracking the market; it’s helping you stay ahead of it.
So, get yourself a monthly premium subscription for only $49. It gives you six times more accurate forecasts than Zillow. And you will be able to unlock 40+ data points, from income-to-value ratios to inventory shifts and price projections. For anyone serious about buying in the right place at the right time, that data could make all the difference.
Upgrade to Reventure Premium


One Response