

The Greensboro, NC housing market is undergoing a significant transformation in 2025. After years of strong growth, the pace of appreciation has sharply declined, indicating a gradual shift toward a more balanced or even cooling market.
With high inventory levels, increased price cuts, and weakening buyer demand across counties, Greensboro is now presenting new opportunities and challenges for buyers, sellers, and investors as they navigate the changing market situation. Let’s explore all of it in detail:
Home Value Growth YoY in Greensboro, NC, Dropped to 0.6% in 2025
Greensboro’s housing market entered a sharp cooldown in 2025, with year-over-year home value growth slowing dramatically to just 0.6%. This marks a steep decline from the 5.8% growth recorded in 2024 and a far cry from the 15.5% peak seen during the post-pandemic housing surge in 2021.
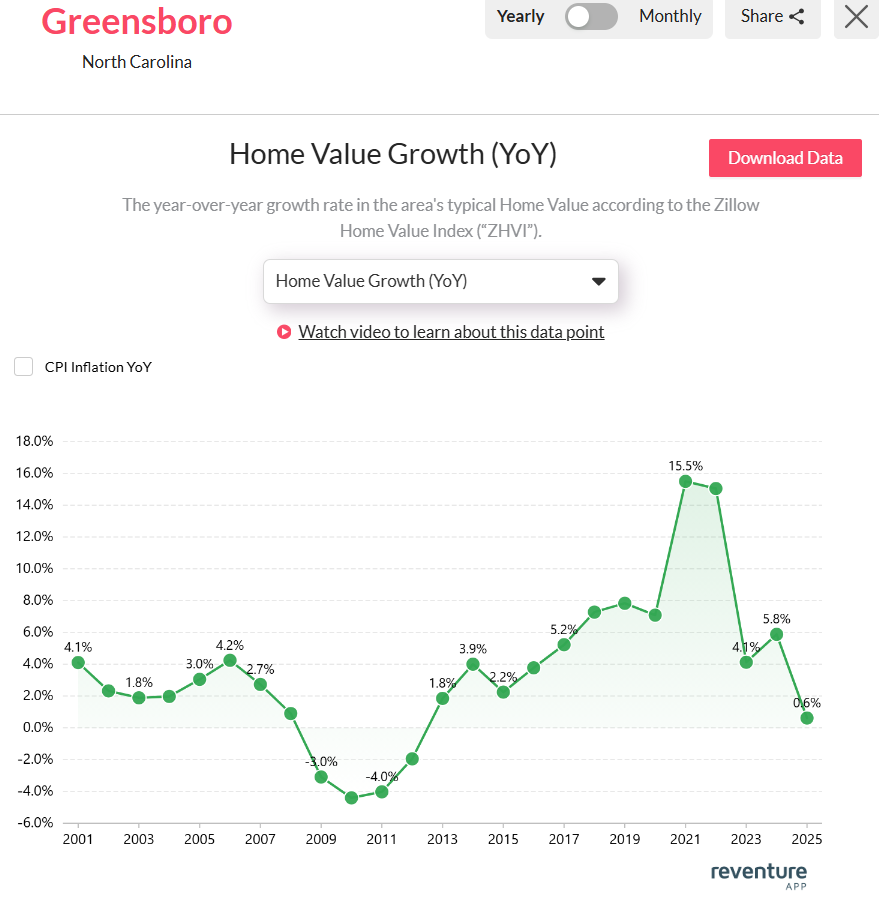
Greensboro, NC’s home value growth dropped to 0.6% in 2025. Access the home value YoY growth graph of the metro here. [Link]
According to the data available on Reventure App, this is the slowest rate of appreciation the city has seen since the early 2010s, when the market was recovering from the Great Recession. The sharp pullback highlights weakening buyer demand amid higher interest rates and concerns about affordability.
Historically, Greensboro’s home value growth has experienced fluctuations, with negative rates as low as -4.0% in 2011. However, the current slowdown appears more aligned with national cooling trends rather than a localized crisis.
While home prices are still up slightly, the current trajectory suggests that a more balanced market is emerging, offering buyers opportunities to negotiate better deals after several years of overheated conditions.
Housing Market Trends in the Counties of Greensboro, NC in 2025
The housing market across Greensboro’s key counties, Guilford, Rockingham, and Randolph, reflects a mixed picture in 2025, with sluggish price appreciation and high levels of price cuts.
Guilford County, the most populous in the metro with over 549,000 residents, posted a modest 0.1% year-over-year home value growth. Despite a significant 1,142 homes listed for sale, the market is soft, with 25.3% of listings experiencing price reductions and homes spending an average of 44 days on the market.
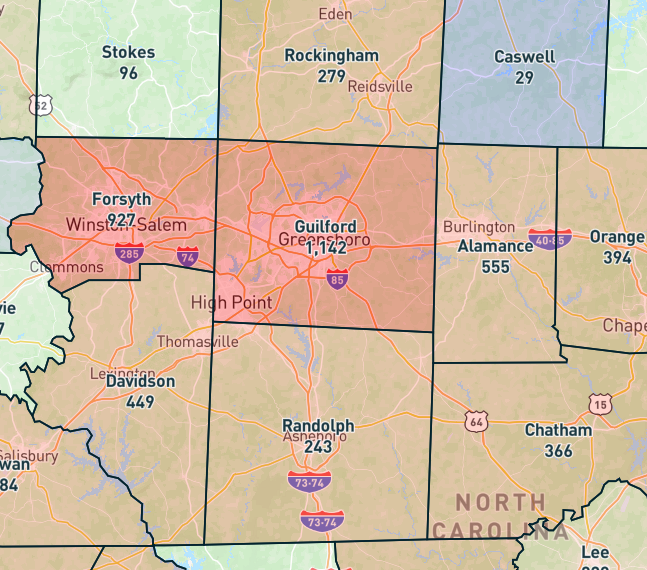
Guilford has the highest sales inventory (1,142) in the Greensboro, NC, metro area. Access the above map here. [Link]
Rockingham County saw a decline in home values, with prices falling by -0.9% YoY. Sellers here are facing steeper challenges, as 25.6% of listings were marked down, and homes sat on the market for 59 days, the longest among the three. The affordability is reflected in a value-to-income ratio of just 3.0, the lowest in the group.
Randolph County, in contrast, showed resilience with a 2.7% YoY home value increase. Inventory is tighter at 243 listings, and while 25.9% of homes had price cuts, the average days on market remained manageable at 45.
According to the data available on Reventure App, Randolph is currently leading Greensboro’s counties in price stability.
Greensboro, NC’s Housing Market Predictions for 2025 – 2026
The Greensboro, NC, housing market is projected to remain stable, with a downward trend expected to continue through 2025–2026. According to the Reventure App, the Home Price Forecast Score for the metro stands at 45 out of 100, indicating that it is now a buyers’ market. On Reventure App, a score below 45 denotes a declining market, 45–55 suggests stability and scores above 55 reflect appreciation.

Greensboro, NC’s Home price forecast score reached 45/ 100 in 2025. Access the home price forecast score chart here. [Link]
The steep drop from a peak score of 72 in 2021–22 to 45 by 2025–26 highlights cooling in the market and reduced buyers’ demand. This downturn suggests slightly more negotiating power for buyers, while sellers must price competitively and stay flexible to close deals. Both homeowners and investors should prepare for further weakening and reassess their strategies in this evolving market situation.
For buyers, sellers, and investors navigating Greensboro’s shifting market, timing and insight are everything. With Reventure’s premium plan for just $39/month, you gain access to state, metro, county, and ZIP code–level forecasts on inventory, pricing, value trends, and market strength. Whether you’re planning to buy smart, sell competitively, or track future moves, Reventure delivers the local data edge you need to stay ahead.
Access Housing Market data for North Carolina and All Other U.S. States on Reventure App.
{
“@context”: “https://schema.org”,
“@type”: “Article”,
“mainEntityOfPage”: {
“@type”: “WebPage”,
“@id”: “https://reventureapp.blog/greensboro-nc-housing-market-situation-in-2025/”
},
“headline”: “Greensboro, NC Housing Market Situation in 2025”,
“image”: “https://reventureapp.blog/wp-content/uploads/2025/07/Greensboro-NC-Housing-Market-Situation-in-2025.jpg”,
“author”: {
“@type”: “Organization”,
“name”: “”,
“url”: “https://reventureapp.blog/author/reventure-data/”
},
“publisher”: {
“@type”: “Organization”,
“name”: “”,
“logo”: {
“@type”: “ImageObject”,
“url”: “”
}
},
“datePublished”: “”
}


