Savannah, GA Home Value Growth YoY Dropped to 1% as Inventory Increases to 1,984 in 2025
 June 17, 2025

The Savannah housing market is experiencing a slowdown, with home value growth YoY declining to just 1% in 2025. This deceleration indicates a cooling market, as inventory levels surge to 1,984 homes for sale. The increased supply suggests a shift towards a buyer’s market, where longer listing periods and heightened seller competition will lead to price reductions.
As Savannah’s real estate market adjusts, prospective buyers will gain more negotiating power, while sellers must adopt competitive pricing strategies to attract offers. Let’s explore the market situation together:
Savannah, GA Home Value Growth YoY Analysis Over the Years
Savannah, GA, has experienced significant shifts in its home values and growth trends over the years. Before the pandemic (2018-2019), the metro’s housing market was experiencing steady appreciation, according to the data available on Reventure App. Home values rose from $199K in 2018 to $210K in 2019, marking a 6% YoY growth. The market was balanced, driven by consistent demand, stable economic conditions, and increasing property values.

Savannah, GA’s home value growth reached 1% in 2025. Access the home value YoY growth graph of the metro here. [Link]
During the pandemic (2020-2022), Savannah’s home value growth YoY dropped a bit to 5% in 2020. However, by 2021, median home values had jumped to $248K, reflecting a remarkable 21% YoY growth, according to data available on Reventure App. This sharp appreciation made Savannah one of the hottest housing markets in the U.S., with record-low inventory levels of -18%. In 2022, home values experienced their highest growth in two decades, rising by 20%.
After the pandemic (2023-onwards), rising mortgage rates and affordability concerns slowed home price growth. By 2023, YoY appreciation had already declined to 9%, and in 2024, it stayed the same. The number of homes for sale surged to 1,123, indicating a market correction. And in 2025, the home value growth dropped to 1%.
Home Value Growth YoY Trend in the Counties of Savannah, GA
The Savannah, GA metro area shows mixed trends in home value growth across its three key counties. Chatham County, home to Savannah itself, saw a year-over-year (YoY) decline of -0.4%, indicating a softening market. In contrast, Bryan County grew by 2.5% and Effingham County by 2.9%, suggesting stronger demand in these suburban or exurban areas.
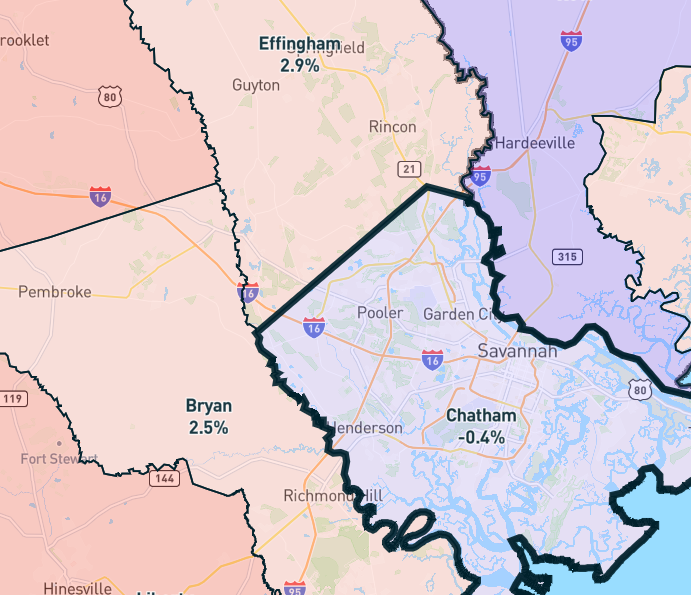
Chatham, GA’s home value growth dropped the most in Savannah in 2025. Access the home value YoY growth map of the counties here. [Link]
Chatham has the highest inventory at 1,338 homes for sale, far outpacing Bryan (362) and Effingham (284), which may explain the dip in value growth. Value-to-income ratios are highest in Chatham (4.7) and lowest in Effingham (4.0), indicating more affordability farther from the urban core.
Price cuts are most frequent in Bryan County (37.4%), possibly due to overpricing amid rising values. Overall, suburban counties are seeing more value resilience, while Chatham’s larger population (303,655) and higher inventory contribute to a more balanced or cooling market.
Savannah, GA’s Housing Market Predictions for 2025 – 2026
The Savannah, GA, housing market is predicted to decline further in 2025 – 2026. The home price forecast score available on Reventure App is 43 out of 100 for the metro, which indicates that it is cooling. It’s important to note that a score below 45 on the App denotes a declining market. Moreover, a score between 45 and 55 represents stability, and a score above 55 indicates an appreciating market on Reventure App.
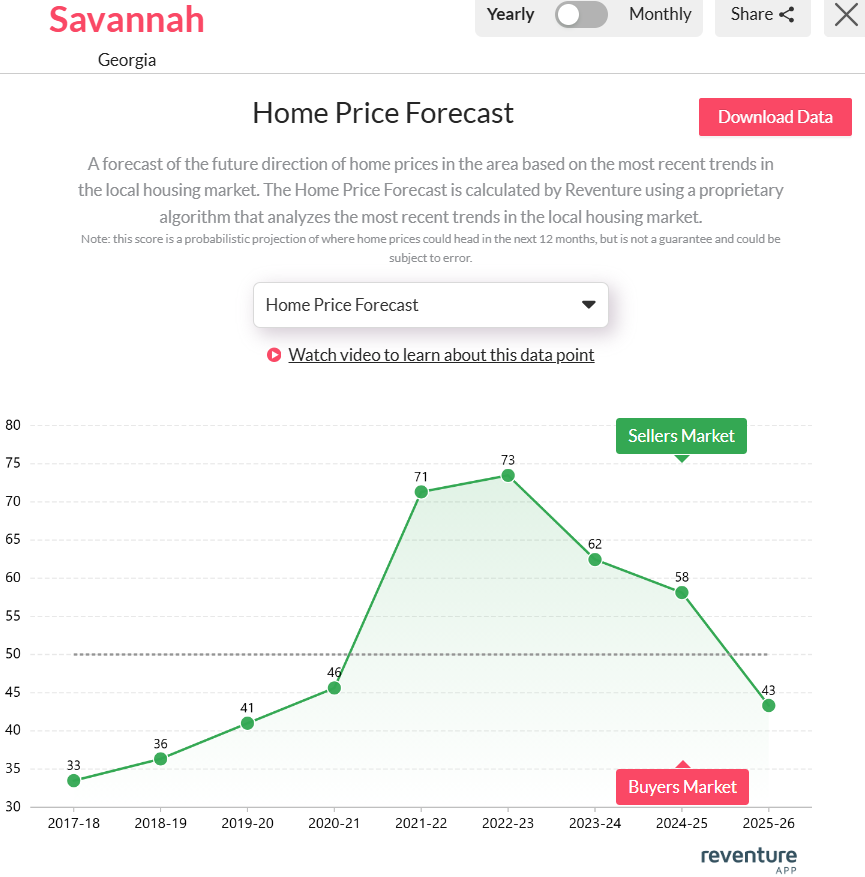
Savannah, GA’s Home price forecast score reached 43/ 100 in 2025. Access the home price forecast score chart here. [Link]
The declining score highlights that Savannah’s real estate sector will face challenges in maintaining stability in 2025. Buyers will gain more negotiating power, and sellers will need to adjust their pricing strategies to close deals. Investors and homeowners should prepare for a softer market, with opportunities for buyers seeking value in a cooling housing environment.
For buyers and sellers trying to make sense of Savannah’s shifting market situation, timing is everything. That’s where Reventure’s premium plan can help. For just $39 per month, you can access detailed, ZIP code–level home price forecasts powered by real-time market data. Whether you’re looking to buy smart, sell strategically, or simply monitor trends, Reventure gives you the tools to stay one step ahead.
Access Housing Market data for Georgia and All Other U.S. States on Reventure App.
{
“@context”: “https://schema.org”,
“@type”: “Article”,
“mainEntityOfPage”: {
“@type”: “WebPage”,
“@id”: “https://reventureapp.blog/savannah-ga-home-value-growth-yoy-analysis-2025/”
},
“headline”: “Savannah, GA Home Value Growth YoY Dropped to 1% as Inventory Increases to 1,984 in 2025”,
“image”: “https://reventureapp.blog/wp-content/uploads/2025/06/Savannah-GA-Home-Value-Growth-YoY-Analysis-2025.jpg”,
“author”: {
“@type”: “Organization”,
“name”: “”,
“url”: “https://reventureapp.blog/author/reventure-data/”
},
“publisher”: {
“@type”: “Organization”,
“name”: “”,
“logo”: {
“@type”: “ImageObject”,
“url”: “”
}
},
“datePublished”: “”
}


