Zillow and Reventure App Data Reveal the 10 Most Overpriced U.S. Counties in 2025 (vs. Rent)
 November 6, 2025
Ever wonder if your county’s home prices have officially gone off the rails? Well, the data says they just might have. According to new numbers from Zillow and Reventure App, many U.S. counties are now more overpriced than ever when compared to local rents. And the gap keeps widening as mortgage rates refuse to budge.
The Mortgage Bankers Association expects 30-year rates to stay stuck between 6% and 6.5% through 2028. Redfin says prices could dip 1% nationally by the end of 2025. While Zillow goes further, projecting a 2% drop this year across more than 400 markets. That’s a tough combo of high rates, falling prices, and rising rent pressure.
So if you’re wondering whether to buy or keep renting, you’re not alone. The numbers show that in many counties, the math just doesn’t work anymore. And by the end of 2025, overpriced markets will finally be called out.
10 Most Overpriced U.S. Counties in 2025
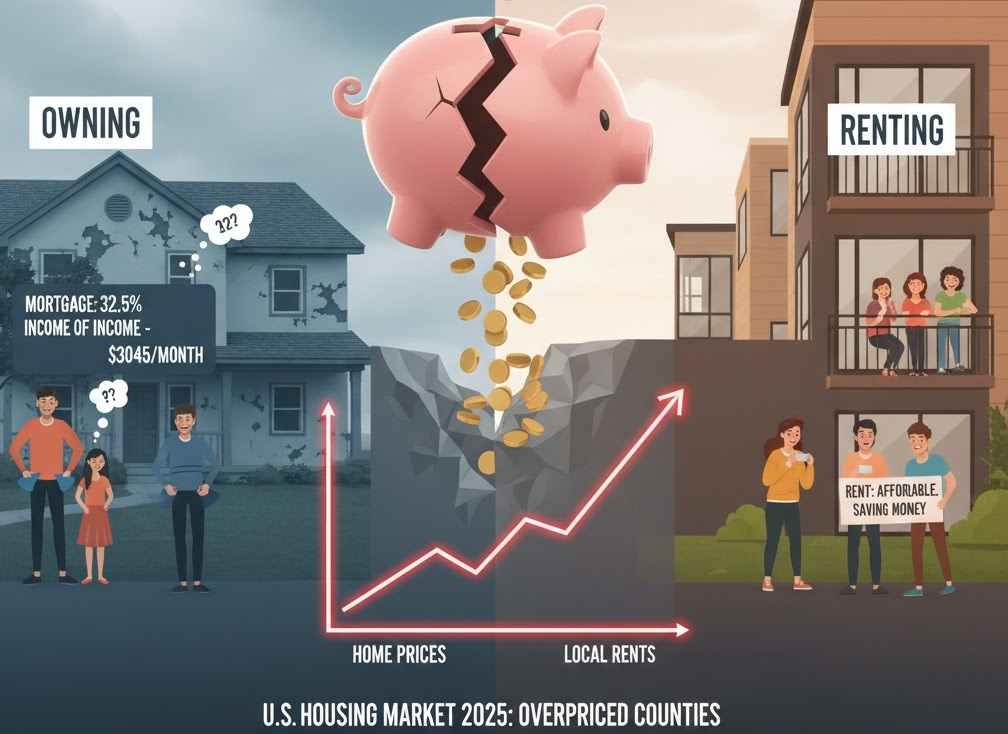
1. DuPage County, Illinois
DuPage tops the list, and not in a good way. Home values here rose 5.0% YoY. While mortgage payments now eat up 32.5% of income, about $3,045 a month. That’s steep for a suburban Chicago county where incomes haven’t kept pace. With nearly 19.4% of listings seeing price cuts, sellers are blinking first. DuPage looks stable on paper, but affordability is cracking underneath.
2. Cuyahoga County, Ohio
Cleveland’s home county looks affordable at first glance. For instance, a 3.1 value-to-income ratio, yet cracks are showing. Prices jumped 4.9% YoY, and rents are lagging. And one-third of sellers are already cutting. Mortgage payments swallow 27% of income, roughly $1,510 a month. It’s not a bubble, but buyers are clearly stretched.
3. Capitol County, Connecticut
At a 3.8 price-to-income ratio and 4.7% annual price growth, Hartford’s area feels deceptively calm. But with payments taking 33% of income, or $2,620 monthly. It’s edging into risk territory. The 16.5% price-cut rate hints that sellers overshot the market. It’s a classic sign of an overpriced pocket inside a stable state.
4. Kings County, New York
No surprises here. Brooklyn remains America’s affordability nightmare. The 11.3 value-to-income ratio says it all. The typical mortgage payment now devours 84.4% of household income, about $5,791 per month. Even though prices only rose 4.5%. That’s still brutal in a market already inflated beyond local wages. With just 11.2% of listings cutting, sellers are still in denial.
5. Middlesex County, New Jersey
Right across the river, things aren’t much prettier. Middlesex shows a 4.9 value-to-income ratio and 4.2% annual growth. Owning now costs 42% of income or $4,103 a month. While only 14% of homes see price cuts. Renters here are sitting pretty.

Reventure App data reveals the top 10 U.S. counties where owning a home in 2025 costs far more than renting. Access the above table here. [Link]
6. Macomb County, Michigan
Detroit’s northern suburb quietly ranks sixth. Home values are up 4%, but the typical mortgage is $1,783, consuming 27.1% of income. With a 29% price-cut rate, Macomb shows early cooling signs. The 3.3 value-to-income ratio looks moderate. But the surge in listings tells another story and affordability fatigue is setting in fast.
7. Bronx County, New York
The Bronx isn’t catching a break either. A staggering 10.6 value-to-income ratio and 81% of income going to housing costs make it one of the most overpriced counties in the entire country. Median payments run about $3,170 per month. With only 10.9% of sellers cutting prices. Renters clearly win this round.
8. Queens County, New York
Queens shows the same urban pain. Mortgage payments now take 64.5% of income, roughly $4,658 a month. Despite just 3.8% price growth, affordability hasn’t improved. The 8.5 value-to-income ratio keeps ownership firmly out of reach for average earners.
9. Jefferson County, Kentucky
Louisville looks tame compared to New York, yet it still cracks the top 10. A 3.5 value-to-income ratio. And 3.8% growth doesn’t sound alarming, but the 31% price-cut rate indicates a slowdown. The $1,605 average mortgage (26.8% of income) makes renting the smarter play for now.
10. Bergen County, New Jersey
Finally, Bergen, another commuter belt county priced like Manhattan light. A 6.0 value-to-income ratio, 3.7% growth, and 49.9% income burden push it into danger. With average payments of $5,167 and only 14% of sellers adjusting, the gap between local wages and housing dreams keeps widening.
Final Thoughts
At some point, every market hits its limit. You can only stretch paychecks so far before people stop playing the game. These counties are already feeling it. Too pricey to buy, too painful to rent, and too stubborn to change. Maybe by the end of 2025, reality sets in, and prices finally start listening to reason.
If you want to see your state, metro, or county’s housing situation, buy Reventure Premium. For just $49 a month, you can access 40+ data points, from mortgage-to-income ratios to home values and inventory growth. And it offers 6x more accurate forecasts than Zillow. Because in a market that’s holding tighter than ever, precision isn’t a luxury.
Upgrade to Reventure Premium