

The West Palm Beach housing market in Palm Beach County is showing clear signs of a shift in 2025. After years of rapid price increases, home values are now falling while inventory continues to rise. These trends indicate a housing market correction unfolding across the region.
The surge in available listings and the softening of prices mark a new phase for buyers, investors, and homeowners alike. With market conditions changing quickly, many are left wondering whether it is the right time to make a purchase or if better opportunities may lie ahead.
This update takes a deep dive into West Palm Beach’s latest housing trends to help you make sense of the data and decide your next move with confidence.
West Palm Beach Home Values Decline in 2025 After Pandemic Surge
The West Palm Beach housing market is entering a cooling phase in 2025, with home values declining by -3.4% year-over-year, according to the latest available data on Reventure App. This marks the sharpest drop since the post-pandemic boom and indicates the start of a broader market correction in Palm Beach County.
Looking at historical trends, the area has seen extreme swings in home value growth over the past two decades. During the 2000s housing bubble, prices surged by over 23.6% in 2005, before crashing to -19.9% in 2009 during the Great Recession. The market recovered gradually through the 2010s, with growth rates stabilizing between 4% and 10%.
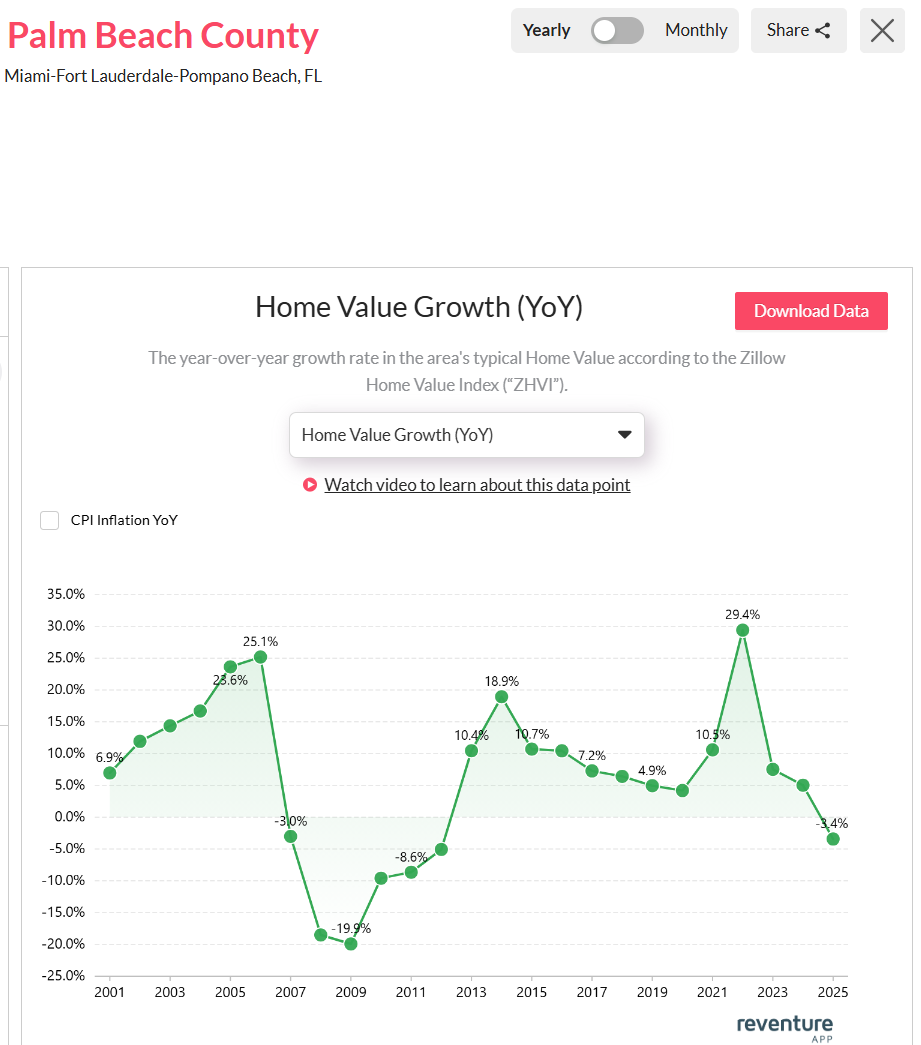
Palm Beach County home values drop by -3.4% in 2025, marking the steepest decline since the Great Recession. Access the above graph here. [Link]
Then came the pandemic housing frenzy. Between 2020 and 2022, values skyrocketed, reaching a peak of 29.4% year-over-year growth in 2022. Fueled by record-low interest rates and migration from urban centers, prices soared across Palm Beach County.
But in 2025, the trend has reversed. As mortgage rates remain elevated and affordability declines, prices are correcting. Buyers now face a very different market, one where falling values and rising inventory may offer new opportunities, but also caution.
West Palm Beach Inventory Hits 10-Year High, Indicating More Price Drops in 2025
The housing inventory in West Palm Beach has surged to its highest level in over a decade. As of 2025, the number of active listings reached 14,738, surpassing even pre-pandemic levels seen in 2017–2019. This sharp rise in supply is one of the strongest signals yet that the local market is undergoing a correction.
During the pandemic housing boom, inventory plummeted. In 2022, it fell to a historic low of just 3,063 active listings, creating intense competition and driving prices to record highs. But since then, the trend has completely reversed.

Housing inventory in Palm Beach County surges to 14,738 in 2025, which is the highest level in over a decade.Access the above graph here. [Link]
In just three years, inventory has nearly quadrupled, growing from 3,063 in 2022 to 14,738 in 2025. That’s even higher than the 2019 figure of 14,108.
This surge in listings reflects a market where sellers are now outpacing buyers. With more homes to choose from and less urgency to act, buyers hold more negotiating power.
Unless demand rebounds strongly, this elevated inventory is likely to put continued downward pressure on home prices in West Palm Beach throughout the rest of 2025.
Best/Worst Neighborhoods to buy in West Palm Beach in 2025
In 2025, West Palm Beach presents a mixed landscape for homebuyers, with some neighborhoods offering attractive price drops and others still showing signs of overvaluation.
Top deals can be found in ZIP code 33417, where home prices have fallen 8.5% year-over-year, and nearly 28% of listings have received price cuts. Despite the decline, the area remains 34.1% overvalued, indicating that there is still room for correction. Similarly, 33401 (downtown West Palm Beach) is seeing values down 4.4% with 30.8% overvaluation, giving buyers negotiating power.

Most ZIP codes in West Palm Beach show negative home value growth in 2025, led by 33417 at -8.5%. Access the above map here. [Link]
In contrast, areas like 33412 and 33413 have smaller declines in value, ranging from -0.5% to -0.6%, and relatively high overvaluation rates, between 21.9% and 29.0%, indicating they could still face price pressure. Neighborhoods with the highest overvaluation and soft demand, such as 33406 and 33405, are also at risk of further correction.
Buyers seeking value should prioritize neighborhoods with high price cuts and steep value drops. However, due diligence is key; some ZIP codes are overvalued despite falling prices, and recovery timelines may vary. Overall, 2025 is a buyer’s market, but location-specific dynamics matter more than ever.
Now the question is, should you buy today or wait? The answer lies in the data, specifically, Reventure App’s Home Price Forecast Score. Available exclusively through the Premium Plan, this score (ranked from 0 to 100) shows you the likelihood of home prices rising or falling over the next 12 months. A score closer to 0 indicates a high risk of further price drops.
Moreover, for just $39/month, you can unlock this powerful tool and see the exact forecast for your specific ZIP code. Paired with our Home Price Conversion Chart, it could help you time the market and save thousands on your next home.


One Response