US in The Biggest Housing Bubble of All-Time in 2025. Even Larger Than 2006
 May 19, 2025

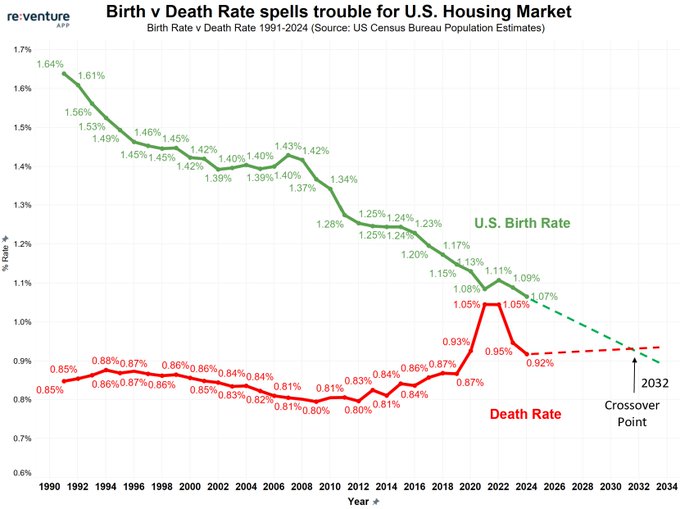
The U.S. housing market has reached an alarming new milestone. According to Reventure Consulting’s long-term analysis of inflation-adjusted Case-Shiller data, home prices in 2025 have surged to a record 299.9 on the Home Price Index, more than double the historical average of 145 and significantly higher than the 266.4 peak of the 2006 bubble.

Inflation-adjusted U.S. home prices have reached an all-time high in 2025, far surpassing the 2006 housing bubble. Access the above graph here. [Link]
Nick Gerli, CEO of Reventure App, warns that the U.S. is now entrenched in the biggest housing bubble in history, stating: “The housing market has never been this unaffordable in U.S. history. We’re now in the biggest housing bubble of all time, and the only period that came close was 2006, before the big crash.”
The graph above shows how today’s prices have massively decoupled from long-term inflation-adjusted norms, rising 67% since 2012 and far outpacing income growth and rental yields.
Gerli adds, “There is no historical precedent for how expensive today’s housing market is. And homebuyers know it.”
With prices at all-time highs and affordability at record lows, economists are sounding the alarm. History suggests bubbles this extreme don’t deflate quietly; they burst.
The Cracks Are Already Showing As Price Cuts Hit Key States in 2025
As home prices soar nationally, several U.S. states are already experiencing steep declines, suggesting the 2025 housing bubble may be starting to deflate. According to Reventure App’s latest data, states like Arizona, Florida, and Colorado are leading the nation in price reductions, with Arizona seeing a 36.8% price cut rate and Florida not far behind at 29.8%.
These aren’t just minor dips. In markets like Florida and Utah, home values are actually falling year-over-year, with Florida posting a -3.1% decline and Utah’s appreciation barely holding at 1.7%. Despite population growth in many of these states, price cuts are widespread, raising serious concerns about sustainability.

Arizona, Florida, and Colorado lead the nation in home price cuts, highlighting early signs of a market correction. Access the above table here. [Link]
Even more alarming is the Value-to-Income ratio, which highlights how stretched affordability has become. In Oregon, the ratio stands at 6.1, meaning the average home costs over six times the average income. Colorado, Nevada, and Utah also have dangerously high ratios above 5.0, far above the national average.
Overvaluation is another red flag. In Georgia, homes are 25.8% overvalued, while Tennessee isn’t far behind at 25.7%. This combination of high prices, falling growth, and massive price cuts points to a fragile market.
As Nick Gerli warned, today’s market is unlike anything in history, and early tremors in these top 10 states could be the first signs of a broader correction. If these trends continue, the U.S. housing bubble of 2025 may not end with a soft landing.
Inventory Surge Indicates Growing Market Imbalance in 2025
Adding to the warning signs, inventory is piling up fast in key housing markets. Florida alone has over 182,000 active listings, the most in the nation, while Texas and California follow with 123,000 and 65,000 homes for sale, respectively. These states are not only seeing slower price growth but also increasing Days on Market, with homes in Florida now sitting for an average of 69 days before selling.

Florida tops the U.S. with over 182,000 homes for sale, as growing inventory reflects declining demand across major states. Access the above table here. [Link]
The rise in supply comes even as demand shows signs of fatigue. In states like Arizona (-1.6%), Texas (-1.3%), and Georgia (-0.5%), year-over-year home values are declining, despite strong population numbers. Even hot markets like Colorado and Tennessee are showing only modest growth, while unsold inventory continues to swell.
If current trends continue, the U.S. housing market could be heading for a significant correction, mirroring the sharp downturn seen after the 2006 bubble burst. Moreover, if you require ZIP code-level information of a specific state’s housing situation, sign up for Reventure Apps’ premium plan for just $39/ month. Get exclusive access to various market metrics across any state, metro, county, or ZIP code in the U.S.
FAQs about U.S. Housing Market
1. Is the U.S. Housing Market More Expensive Now Than During the 2006 Bubble?
Yes. According to inflation-adjusted Case-Shiller data, home prices in 2025 have reached an all-time high of 299.9, far surpassing the 266.4 peak seen in 2006, making the current market the most unaffordable in U.S. history.
2. Which States Are Most Affected by the 2025 Housing Correction?
States like Arizona, Florida, and Colorado are seeing the largest price cuts, with Arizona experiencing a 36.8% reduction. Meanwhile, inventory is spiking in Florida, Texas, and California, suggesting market stress across Sunbelt states.
Access Housing Market data for all the U.S. States on Reventure App.