Top 10 U.S. Metros Where Homes Sit Longest in 2025: What’s Ahead for 2026
 October 21, 2025
Homes across the U.S. aren’t flying off the market like they used to. In 2025, even well-priced listings are taking longer to sell as higher mortgage rates and affordability concerns cool buyer urgency. For sellers, that means more days of waiting and more pressure to price realistically.
But what do these longer listing times really tell us about where the market is headed? Some metros are slowing faster than others. And that says a lot about shifting demand, local economies, and what buyers might expect next year.
Here’s a look at the top 10 markets where homes sat longest in 2025 and what could change in 2026:
1. New York, NY: Slow and Stubborn
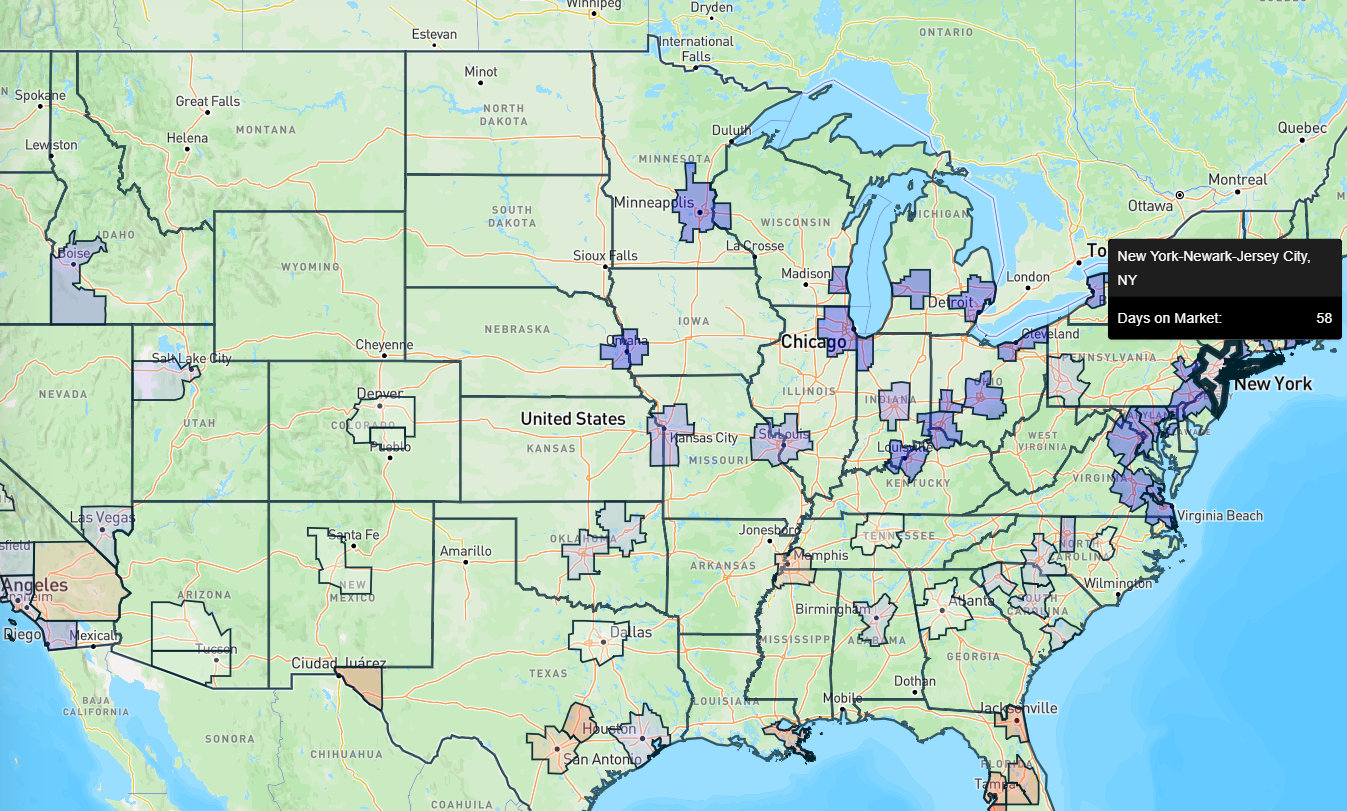
New York tops the list with homes taking 58 days to sell in 2025. Inventory reached 35,892 listings, and prices still rose 3.1% year over year. But a value-to-income ratio of 7.0 keeps many buyers on the sidelines. Only 11.6% of sellers cut prices, showing little flexibility. Unless borrowing costs drop, 2026 could bring more price adjustments before demand picks up.
2. Houston, TX: Busy Market, Slower Sales
Houston sits close behind with a 56-day average and over 34,000 active listings. Prices slipped 2%, and about 23% of sellers lowered expectations. With a 3.7 value-to-income ratio, homes are still affordable compared to many metros. Yet economic uncertainty and slower migration have cooled buyer confidence. Expect steadier but slower sales through 2026.

Cities like New York, Dallas, and Tampa are leading a nationwide slowdown that hints at a cooler 2026 market. Access the above graph here. [Link]
3. Dallas, TX: Supply Rising, Values Falling
Dallas homes now take 63 days to move, the longest among Texas metros. Prices fell 3.8%, and 33.6% of sellers made cuts. Inventory rose to 30,064 homes, keeping competition high. Affordability at 3.8 looks good, but higher mortgage rates keep buyers cautious. The city’s growth story isn’t over. It’s just on pause heading into 2026.
4. Atlanta, GA: Cooling After the Boom
Atlanta listings sit for about 60 days, indicating the post-pandemic slowdown has arrived. Prices dropped 3%, and 30% of sellers reduced asking prices. Inventory climbed to 28,504 homes, the most in years. With a 4.0 value-to-income ratio, buyers have options, but confidence is mixed. The market is likely to stay balanced but quiet next year.
5. Los Angeles, CA: Expensive and Hesitant
In Los Angeles, listings take 57 days to sell. Prices slipped 0.9%, but the 9.6 value-to-income ratio keeps affordability out of reach. Only 20% of sellers offered price cuts, reflecting firm pricing in a tough market. Inventory at 19,318 homes shows supply is steady, but buyers remain limited. A mild correction could follow if rates stay high in 2026.
6. Tampa, FL: A Clear Cooldown
Tampa’s 79-day average marks one of the slowest turnarounds nationwide. Prices are down 6.3%, and 32% of sellers cut prices. Inventory climbed to 18,674 homes, outpacing demand. The 4.5 value-to-income ratio is fair. But higher insurance costs are weighing heavily. With storms and financing costs in play, Tampa’s rebound may be slow in 2026.
7. Phoenix, AZ: Reset in Progress
Phoenix listings linger for 65 days on average. Home values fell 3.6%, and 34% of sellers offered price cuts, the highest share on this list. Inventory hit 17,070 homes. The 4.8 value-to-income ratio remains manageable, yet demand has clearly softened. After years of rapid gains, Phoenix is finding its new normal heading into 2026.
8. Chicago, IL: Steady and Affordable
Chicago averages 38 days on market, shorter than most big metros. Prices actually rose 3.4%, and just 21.9% of listings saw cuts. With 16,832 homes for sale and a 3.6 value-to-income ratio, affordability remains strong. Chicago’s pace is slower than in past years but stable. The city looks set to hold its ground through 2026.
9. Washington, DC: Balanced but Careful
Homes in Washington, DC, spend about 38 days on the market. Prices grew 0.8%, while 24.6% of sellers lowered prices. Inventory stands at 14,270 homes. With a 4.4 value-to-income ratio, the market feels balanced but cautious. As the local job market steadies, 2026 may bring only mild shifts rather than sharp swings.
10. Orlando, FL: Longer Waits Ahead
Orlando also averages 79 days before closing. Prices dropped 4.3%, and 27.5% of sellers reduced asking prices. Inventory is now 13,828 homes, showing a clear buildup. The 4.7 value-to-income ratio suggests fair value, but buyer demand has cooled. Orlando’s strong tourism base should prevent deeper declines, though growth will stay modest next year.
Final Thoughts
Across the top 10 metros, homes are sitting longer and sellers are trimming prices more often. Affordability remains the key barrier. Buyers have more choices, but they’re taking their time. Markets like Chicago and Houston may stabilize first, while pricier metros such as Los Angeles and New York adjust more slowly. As 2026 approaches, patience, not panic, seems to define this new housing cycle.
If you want to see your state, metro, or county’s housing situation, buy Reventure Premium. For just $49 a month, you can access 40+ data points, from mortgage-to-income ratios to home values and inventory growth. And it offers 6x more accurate forecasts than Zillow. Because in a market that’s holding tighter than ever, precision isn’t a luxury.
Upgrade to Reventure Premium