The St. Petersburg and Clearwater housing markets in Pinellas County are going through a noticeable shift in 2025. Home prices are starting to fall, and the number of listings is climbing. After years of rapid growth, this increase in inventory and drop in prices point to a market correction. These changes are making buyers and sellers rethink their strategies. Is it a smart time to buy a house right now, or could waiting lead to a better deal? Let’s take a closer look at the current trends shaping the local real estate situation of St. Petersburg.
St. Petersburg’s Historical Home Value Growth Trends
Over the past two decades, St. Petersburg has seen sharp swings in home value growth. During the mid-2000s housing boom, values climbed rapidly, reaching growth rates of over 24% year-over-year in 2005 and 2006. However, this was followed by a steep decline during the 2008 financial crisis, when prices dropped as much as 17.6% annually.
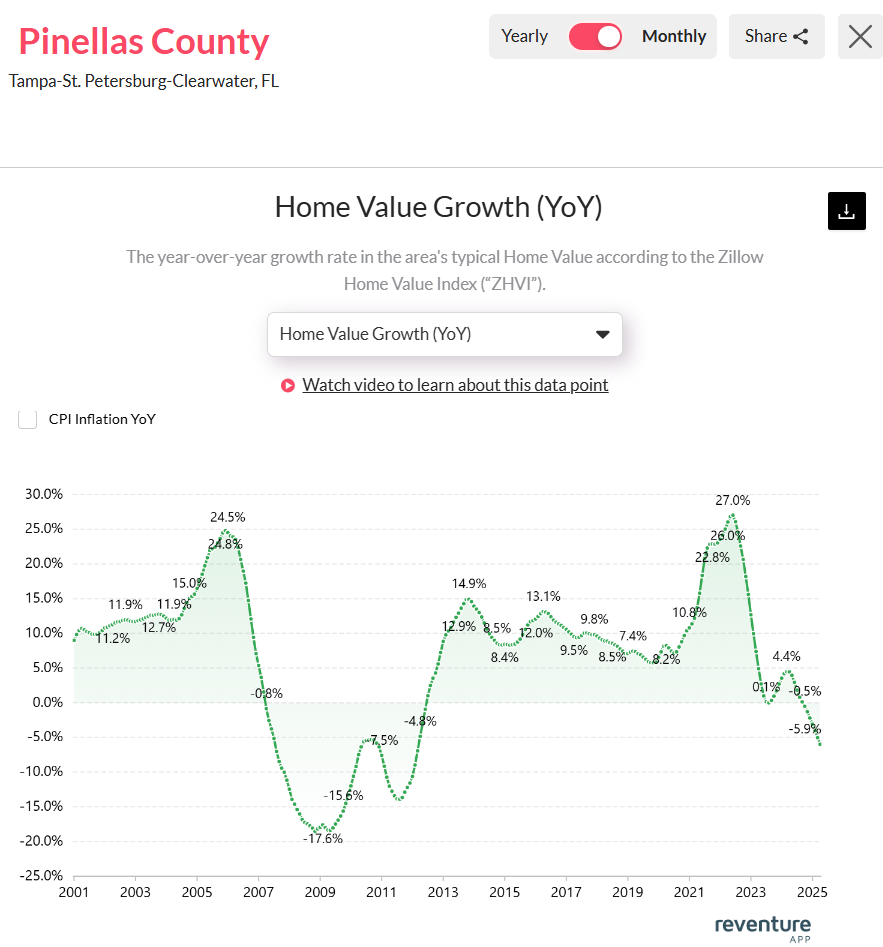
Home prices in St. Petersburg surged during the pandemic but are now falling at their fastest rate since the 2008 crash. Access the above graph here. [Link]
The market gradually recovered, with steady growth through the 2010s. From 2013 to 2019, home values in St. Petersburg typically increased between 7% and 13% each year. Then came the pandemic-era surge. Fueled by low interest rates, remote work, and migration trends, home value growth spiked to an all-time high of 27% in 2022.
That momentum has since reversed. By 2024, year-over-year home values in St. Petersburg had declined by 5.9%. As of early 2025, the latest data shows a further annual decline of 6.5%. These back-to-back drops are clear signs of a correction. After years of aggressive appreciation, prices are cooling quickly, offering new dynamics for buyers and investors alike heading into the rest of 2025.
Inventory Surge in 2025 Points to More Price Drops Ahead
One of the biggest changes in the St. Petersburg housing market in 2025 is the rapid rise in inventory. According to the latest data available on Reventure App, the number of homes listed for sale has climbed to 8,003, marking the highest level in at least a decade.
Just three years ago, in 2022, inventory had dropped to a low of 1,233 homes, the result of strong demand and record-low interest rates. Buyers were competing for a limited number of properties, driving up prices.

Housing inventory in St. Petersburg has hit a 10-year high in 2025, more than doubling in just two years. Access the above graph here. [Link]
Now, the market has flipped. Listings have more than doubled over the past year, rising from 3,186 in 2023 to over 8,000 in 2025. This sharp increase in supply is easing the pressure on buyers and pushing prices downward.
When inventory climbs this fast, it usually takes time for the market to stabilize. With more options available and cooling demand, sellers are being forced to lower prices or sit on unsold homes.
The supply spike suggests that the current price correction may continue for several more months. For buyers, this could mean more negotiating power. For sellers, it may be time to adjust expectations as the market moves back toward balance.
Best/Worst Neighborhoods to buy in St. Petersburg/Clearwater in 2025
Several ZIP codes across St. Petersburg and Clearwater have seen sharp home value declines in 2025, making them areas to watch for buyers and investors. The steepest drop is in ZIP code 33716 (St. Petersburg), where home values are down 13.7% year-over-year. This area also has a relatively low home value of $183,196, with nearly 29% of listings seeing price cuts.
In 33706 and 33708, both parts of St. Petersburg, values are down 10.9% and 9.9%, with home prices over $550,000 and price cuts near 32%. These high-end ZIP codes are softening fast.

ZIP code map shows widespread home value declines across St. Petersburg, with some areas down over -8% year-over-year. Access the above map here. [Link]
Clearwater’s 33760 saw a 9.1% decline, with 41.4% of homes undergoing price reductions. Similarly, 33762 (Clearwater) has dropped 6.8%, but has one of the highest price cut rates at 46.5%. Other weak spots include 33703, 33702, and 33705 in St. Petersburg, all with declines above 6% and significant markdowns. For bargain hunters, areas like 33710 (down 4.4%) and 33713 (down 4.8%) in St. Petersburg may offer deals, especially with over 50% of listings seeing price cuts.
How much will prices drop in St. Petersburg in the next year? Should you buy today or hold off for a better deal? With the housing market shifting fast in 2025, these are the questions every smart buyer needs to answer.
That’s where the Reventure App comes in. By upgrading to Reventure Premium, you gain access to our exclusive Home Price Forecast Score, a powerful tool ranked from 0 to 100 that reveals the likely direction of home prices in your ZIP code over the next 12 months. The closer the score is to 0, the greater the risk of price declines.
Moreover, for just $39/month, you’ll also unlock our home price conversion chart, which helps you visualize how falling prices can affect affordability. Whether you’re buying your first home or investing, these insights could save you thousands.