

Raleigh, NC’s housing market is entering a phase of correction in 2025, following the explosive growth during the pandemic years. Home values are declining, and inventory is increasing as buyer demand slows. County-level data from Wake, Johnston, and Franklin reflect mixed trends, while forecasts suggest further weakening ahead. Here’s a complete breakdown of Raleigh’s real estate outlook, backed by insights from the Reventure App:
Raleigh, NC’s Home Value Growth YoY Dropped to -1.3% in 2025
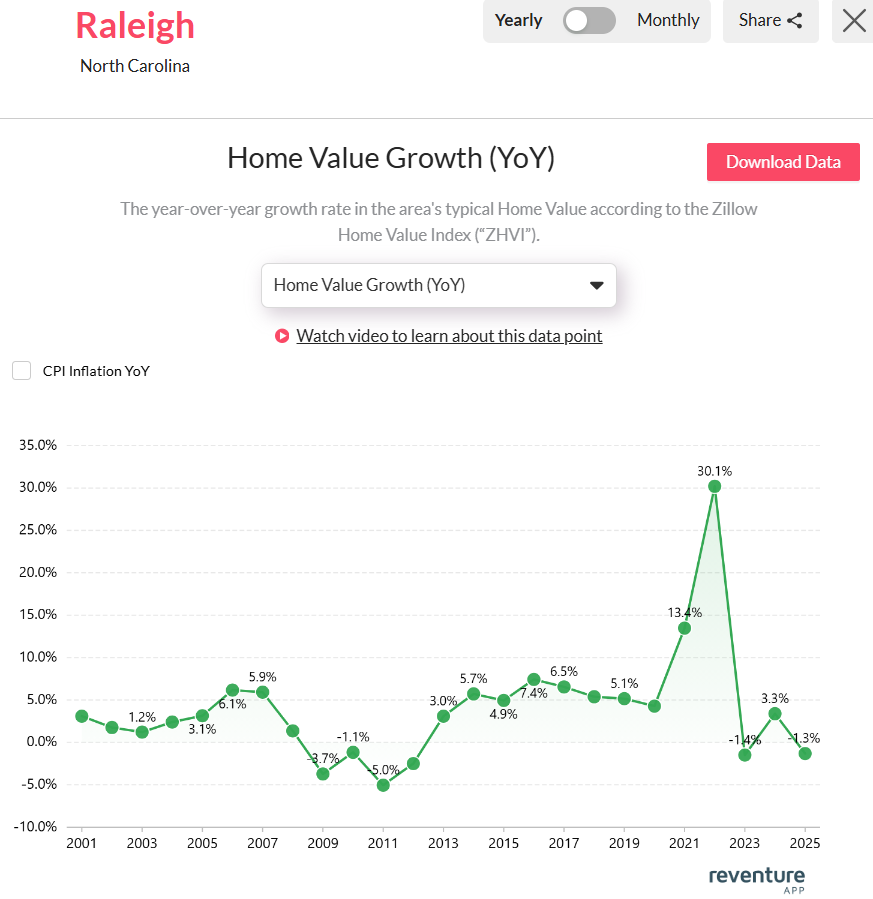
Raleigh’s housing market is showing clear signs of a cooldown in 2025. After experiencing a sharp decline in 2023 with a YoY home value drop of -1.4%, the downward trend has continued into 2025, though slightly less severe, with home values falling by -1.3%.
According to data on Reventure App, this decline follows a dramatic surge during the pandemic housing boom, when home value growth in Raleigh spiked to an astonishing 30.1% in 2021. Since then, the market has undergone a steep correction, erasing much of the momentum gained during those peak years.
Raleigh, NC’s home value growth dropped to -1.3% in 2025. Access the home value YoY growth graph of the metro here. [Link]
Raleigh’s market volatility reflects broader economic pressures, rising mortgage rates, and affordability challenges that are cooling buyer demand. While the area remains fundamentally strong due to job growth and population inflows, prices are now stabilizing or, in this case, slightly retracting, as the market seeks balance.
For buyers, this may indicate better opportunities ahead. For sellers, adjusting expectations is key as Raleigh moves into a more neutral or even slightly buyer-favored market environment.
Housing Market Trends in the Counties of Raleigh, NC in 2025
The housing market across Raleigh’s primary counties, i.e., Wake, Johnston, and Franklin, is experiencing a clear recalibration in 2025, reflecting the broader regional downturn. Wake County, home to Raleigh’s urban core, has seen a YoY home value decline of -1.0%, accompanied by a significant 32.0% of listings undergoing price cuts. Inventory is high at 3,702 units, with homes spending an average of 43 days on the market. The cap rate sits at 3.9%, indicating moderate investment returns.

Wake has the highest sales inventory (3,702) in the Raleigh, NC, metro area. Access the above map here. [Link]
Johnston County, located to the southeast of Raleigh, is also facing downward pressure, with home values dropping by -1.1% YoY. With 1,085 homes on the market, 26.4% of listings have reduced prices, and the average time on market is 56 days. Johnston’s 4.6% cap rate makes it slightly more attractive to investors.
In contrast, Franklin County remains resilient. It recorded a slight YoY growth of 0.1% in home values, and although 27.3% of listings saw price reductions, it indicates a more balanced market. According to data on Reventure App, Franklin’s slower pace may offer more stability amid regional volatility.
Raleigh, NC’s Housing Market Predictions for 2025 – 2026
The Raleigh, NC, housing market is projected to decline further in 2025–2026. According to the Reventure App, the Home Price Forecast Score for the metro stands at 36 out of 100, indicating that it is now a buyers’ market. On Reventure App, a score below 45 denotes a declining market, 45–55 suggests stability and scores above 55 reflect appreciation.

Raleigh, NC’s Home price forecast score reached 36/ 100 in 2025. Access the home price forecast score chart here. [Link]
The steep drop from a peak score of 77 in 2022–23 to 36 by 2025–26 highlights the extreme cooling in the market and reduced buyers’ demand. This downturn suggests more negotiating power for buyers, while sellers must price competitively and stay flexible to close deals. Both homeowners and investors should prepare for further weakening and reassess their strategies in this evolving market situation.
For buyers, sellers, and investors navigating Raleigh’s shifting market, timing and insight are everything. With Reventure’s premium plan for just $39/month, you gain access to state, metro, county, and ZIP code–level forecasts on inventory, pricing, value trends, and market strength. Whether you’re planning to buy smart, sell competitively, or track future moves, Reventure delivers the local data edge you need to stay ahead.
Access Housing Market data for North Carolina and All Other U.S. States on Reventure App.
{
“@context”: “https://schema.org”,
“@type”: “Article”,
“mainEntityOfPage”: {
“@type”: “WebPage”,
“@id”: “https://reventureapp.blog/raleigh-nc-housing-market-situation-in-2025/”
},
“headline”: “Raleigh, NC Housing Market Situation in 2025”,
“image”: “https://reventureapp.blog/wp-content/uploads/2025/07/Raleigh-NC-Housing-Market-Situation-in-2025.jpg”,
“author”: {
“@type”: “Organization”,
“name”: “”,
“url”: “https://reventureapp.blog/author/reventure-data/”
},
“publisher”: {
“@type”: “Organization”,
“name”: “”,
“logo”: {
“@type”: “ImageObject”,
“url”: “”
}
},
“datePublished”: “”
}


One Response