Portland’s housing market faced challenges in 2025. Prices dipped slightly, and growth slowed in most counties. Inventory rose, and more homes saw price cuts. Buyers gained more choice, while sellers faced longer waits. Forecasts point to further weakness in 2026.
According to the data available on Reventure App, the market has moved into a declining phase. Trends now suggest a shift from past surges to a cooler and more competitive environment.
Portland, OR’s Home Value Growth YoY Dropped to -0.3% in 2025
Portland’s housing market slowed again in 2025. Home value growth fell to -0.3%. This comes after a small gain of 1.6% in 2024. The drop shows that prices have flattened. According to the data available on Reventure App, this is one of the weakest results since 2012.  Portland, OR’s home value growth dropped to -0.3 in 2025. Access the home value YoY growth graph of the metro here. [Link]
The city has seen bigger swings in the past. In 2022, growth reached 17.1%. In 2006, it was even higher at 22.4%. There have also been sharp declines. The largest was in 2009 at -11.4%. Smaller drops followed in 2010, 2008, and 2023.
Recent years show a shift from rapid gains to slower growth. Buyers now have more room to negotiate. Sellers face longer listing times. The market no longer mirrors the surges seen in 2020 and 2021. If trends continue, prices may stay flat or fall further in the short term. This makes 2025 a year of adjustment for Portland real estate.
Housing Market Trends in All Counties of Portland, OR in 2025
The Portland housing market in 2025 shows mixed results across its counties. Multnomah County saw a -0.4% drop in home values. Washington County fell by -0.8%. Clark County in Washington State also dipped by -0.3%. Clackamas County rose slightly by 0.3%. According to the data available on Reventure App, these figures show a slowdown in most areas.
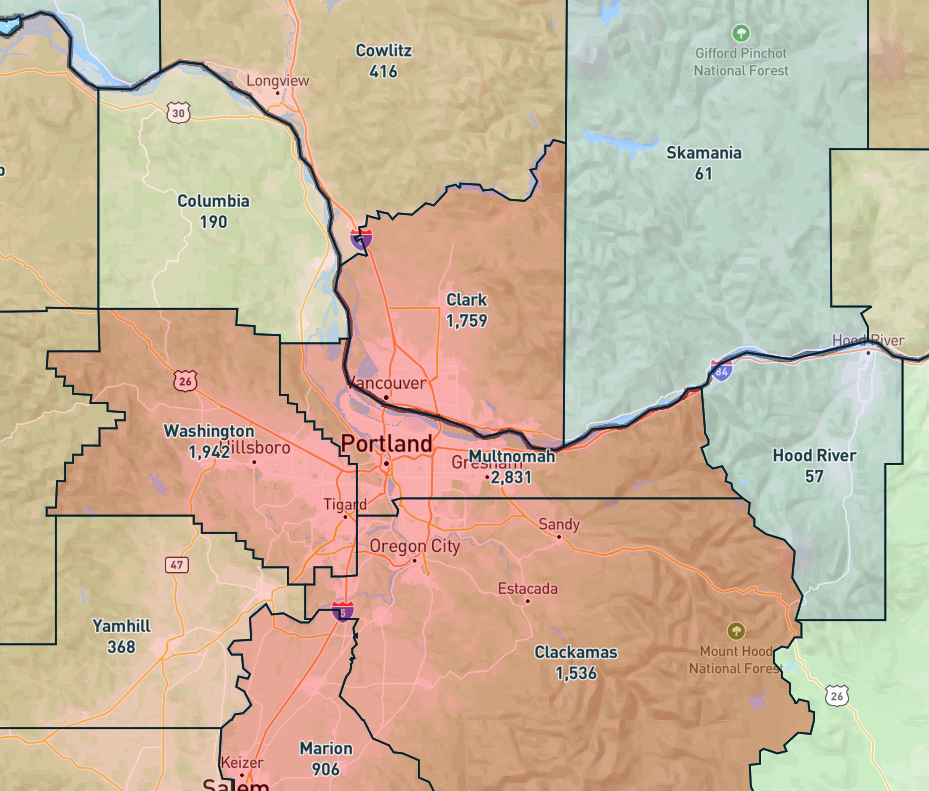 Multnomah County has the highest sales inventory (2,831) in the Portland, OR, metro area. Access the above map here. [Link]
For sale inventory is highest in Multnomah at 2,831 homes. Washington County has 1,942, while Clark has 1,759. Clackamas follows with 1,536. Smaller markets like Yamhill, with 368 homes, and Columbia, with 190, have limited supply. Price cuts are common. Washington County leads with 43.5% of listings seeing reductions. Multnomah, Clark, and Clackamas also show cuts near 39%.
Days on market vary from 51 in Washington and Clark to 59 in Clackamas. Overvaluation is highest in Columbia at 17.6%. Clark follows at 12.1%, and Yamhill at 10.9%. Larger counties like Multnomah show low overvaluation at 1.6%.
Population sizes range from nearly 790,000 in Multnomah to just over 53,000 in Columbia. The trends suggest a slower market with more price adjustments. Buyers have options, but sellers face longer waits and more competition.
Portland, OR’s Housing Market Predictions for 2025 – 2026
Portland’s housing market score is now 35 out of 100. This is well below the stable range of 45 to 55. According to the data available on Reventure App, a score below 45 means a declining market. Buyer demand is lower. More sellers are entering the market. Homes are taking longer to sell. Price cuts are becoming more common.
Portland, OR’s Home price forecast score reached 35/ 100 in 2025. Access the home price forecast score chart here. [Link]
The forecast suggests possible home price declines in the next year. The score has fallen from 44 in 2024 to 35 in 2025. This shows a steady weakening over time. Conditions now favor buyers more than sellers. Inventory may rise further if demand stays low. Sellers may have to adjust prices to attract offers. The next 12 months could bring more downward pressure on values.
For buyers, sellers, and investors navigating Portland, OR’s shifting market, timing and insight are everything. And for insights, you can get Reventure’s premium plan for just $39/month. It gives forecasts for state, metro, county, and ZIP code levels. You can track inventory, prices, value trends, and market strength. Plan to buy smart. Plan to sell well or just follow the market. Reventure gives you the local data you need to stay ahead.