Phoenix, AZ Housing Market Sees 37.3% Price Cuts on 7,794 Homes for Sale in 2025
 February 7, 2025

The Phoenix, AZ housing market is seeing a significant rise in price cuts as it enters 2025, indicating a declining market. Data available on Reventure App reveals that 37.3% of home listings in the Phoenix, AZ metro area have experienced price reductions, affecting 7,794 homes for sale out of a total inventory of 20,865. This trend suggests growing inventory and shifting market conditions, possibly influenced by higher mortgage rates and slowing demand. Buyers will find more negotiating power, while sellers adjust to maintain competitive pricing in a softening housing market.
Phoenix, AZ’s Price Cut % Analysis Over the Years
The Phoenix housing market has witnessed significant shifts in price reductions over the years, with a clear dip during the pandemic and a sharp rise post-2022. Before the COVID-19 pandemic, Phoenix, AZ had stable price cut trends. From 2017 to 2019, the percentage of listings with price reductions remained around 35.3% (2017), 36.3% (2018), and 37.5% (2019), highlighting a balanced market.

Phoenix, AZ’s price cut % increased to 37.3% in 2025. Access the price cut % chart of Phoenix, AZ here. [Link]
During the pandemic (2020-2021), price cuts dropped to 28.5% in 2020 and fell further to 10.4% in 2021, driven by historically low interest rates and surging home demand. Post-pandemic (2022-2025), the trend reversed. In 2022, price cuts remained low at 9.8% but spiked to 41.2% in 2023 as rising mortgage rates reduced affordability. By 2024, price cuts dropped to 32.3%, but rebounded to 37.3% in 2025. This trend indicates a cooling market where sellers must lower prices to attract buyers amid growing inventory and affordability challenges.
Price Cut % Trend in Counties of Phoenix, AZ
The Phoenix metro area includes Maricopa and Pinal counties and both these counties are seeing significant price reductions in 2025. Maricopa County, which includes Phoenix, saw price cuts rise to 37.9% in 2025, reflecting increased inventory and shifting market conditions. Before the pandemic, price cuts ranged between 35.8% (2017), 37.2% (2018), and 38.6% (2019).
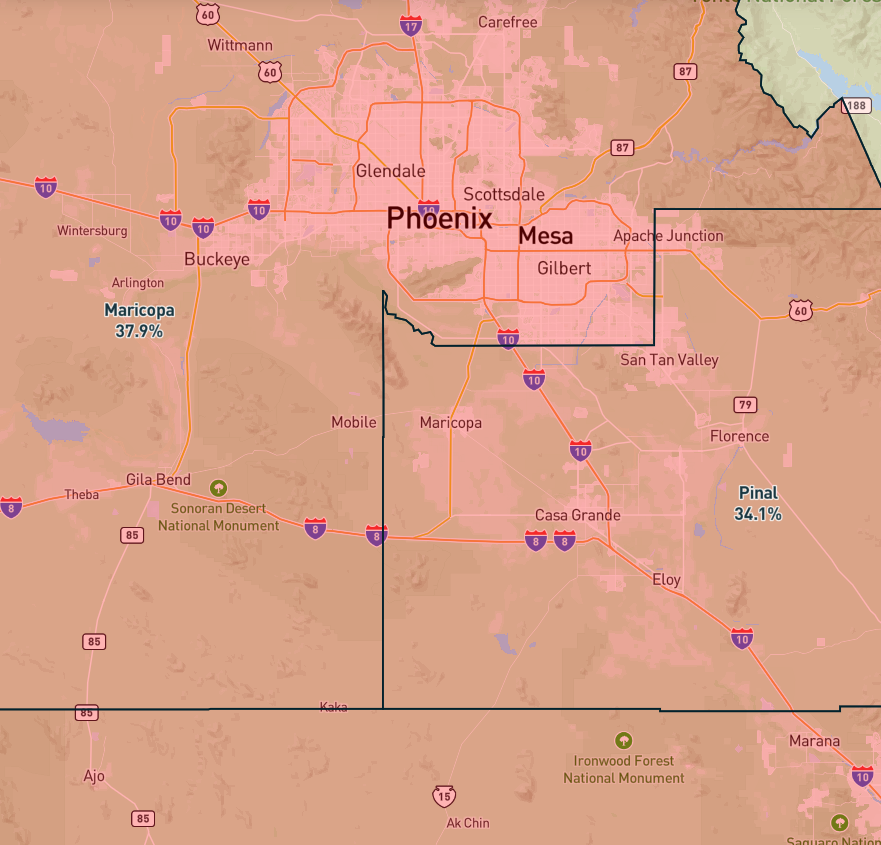
Pinal County showed a slower price cut % increase compared to Maricopa County. Access the price cut % map of the counties here. [Link]
However, during the pandemic (2020-2021), reductions dropped significantly to 24.0% in 2020 and a record-low 1.1% in 2021 due to high buyer demand. Post-pandemic, the market rebounded, with price cuts surging to 41.8% in 2023, dipping to 31.9% in 2024, and rising again in 2025.
In Pinal County, price reductions followed a similar pattern but at a slightly lower rate. Pre-pandemic figures hovered around 29.5% (2017), 28.9% (2018), and 29.4% (2019). During the pandemic, cuts dropped to 10.9% in 2020 and 6.2% in 2021. Post-pandemic price cuts spike to 39.6% in 2023 and slightly reduced to 34.1% in 2025. These trends indicate a cooling market where sellers must lower prices to attract buyers in a high-inventory environment.
Phoenix, AZ’s Housing Market Predictions in 2025
Phoenix’s housing market is expected to decline in 2025, with a home price forecast score of 40 out of 100, indicating weakening conditions. It is important to know that a score below 45 on Reventure App suggests reduced buyer demand, more sellers, longer days on the market, and increased price cuts, all leading to potential future home price declines.

Phoenix, AZ Home price forecast score reached 40/ 100 in 2025. Access the home price forecast score chart here. [Link]
Factors contributing to this trend include higher mortgage rates, growing inventory, and affordability challenges. As a result, sellers will need to lower prices to attract buyers, while longer listing periods and price cuts are likely to define the Phoenix housing market in 2025. If you want a detailed analysis of the Phoenix, AZ metro area, explore the housing market data at the ZIP-code level on Reventure App.
Access Housing Market data for Arizona and other States on Reventure App.


One Response