

The Orange County housing market is entering a new phase in 2025. After years of volatility and rapid appreciation, growth is slowing, and key indicators point toward a stabilizing or even cooling trend. Backed by ZIP-level insights from Reventure App, this article explores price trends, forecast scores, and buyer-seller dynamics across Irvine, Huntington Beach, Santa Ana, and other major OC neighborhoods.
Home Value Growth YoY of Orange County Dropped to 4.6% in 2025
Orange County’s housing market has seen a cooling trend in 2025, with home value growth dropping to just 4.6% year-over-year, according to Reventure data. This marks a sharp deceleration compared to the 13.1% growth in 2024 and the explosive 22.5% rise in 2021.

Orange County, CA’s home value growth dropped to 4.6% in 2025. Access the home value YoY growth graph of the metro here. [Link]
Historically, Orange County has experienced highly volatile swings in home value growth. Peak growth occurred in 2004, reaching 26.0%, followed closely by 19.4% in 2005. However, the 2008 financial crisis saw values plummet, with growth hitting a low of -18.7% in 2008 and -13.1% in 2009.
More recently, after a COVID-era surge, the market corrected with a dip to -3.1% in 2023, before rebounding in 2024. The current 2025 rate of 4.6% suggests a move toward stabilization, yet it is still well below past booms.
This moderation may indicate growing affordability concerns, rising mortgage rates, or softened demand. As the broader Los Angeles-Long Beach-Anaheim metro recalibrates, Orange County appears to be settling into a slower, more sustainable growth phase.
Housing Market Trends in Orange County, CA in 2025
According to data available on Reventure App, the 2025 housing market in Orange County reveals considerable variation across different ZIP codes and cities, with Irvine emerging as a high-growth area.
ZIP code 92620 in Irvine recorded the strongest home value growth at 9.6%, alongside a high overvaluation rate of 52.0%. Other Irvine ZIPs, such as 92602 and 92612, also posted solid growth rates of 9.2% and 9.1%, respectively. However, ZIP 92606 stood out with a 10.3% growth despite a relatively smaller inventory of 17 homes.
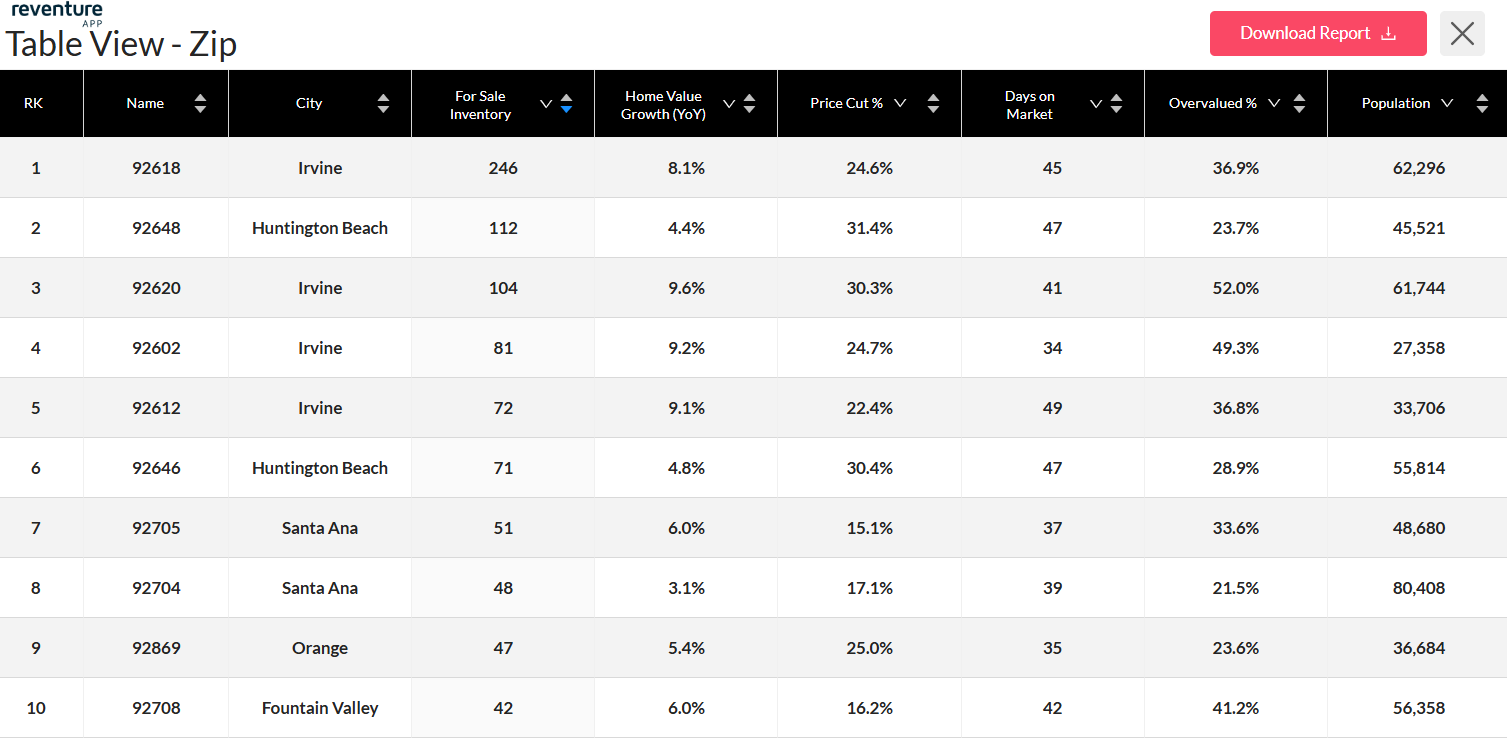
92618 and 92648 have the highest for-sale inventory in Orange County, CA, in 2025. Access the above table here. [Link]
In contrast, Santa Ana ZIPs such as 92703, 92704, and 92706 showed more modest growth, ranging between 3.0% to 6.0%, coupled with lower overvaluation percentages. Huntington Beach ZIP 92648 showed a softer 4.4% YoY growth but had one of the highest price cut rates at 31.4%, suggesting price flexibility in a slower market.
Meanwhile, Garden Grove and Orange ZIPs typically saw moderate growth (3–5%) and lower inventory levels, reflecting tighter supply. These patterns highlight Orange County’s mixed dynamics in 2025; some neighborhoods remain competitive while others offer opportunities for buyers.
Orange County, CA’s Housing Market Predictions for 2025 – 2026
The Orange County housing market is showing signs of a shift in 2025–2026. According to the Reventure App, the Home Price Forecast Score for the metro stands at 47 out of 100, indicating a transition toward a neutral-to-buyers’ market. On the Reventure scale, a score below 45 indicates a declining market, 45–55 suggests market stability, and scores above 55 point to appreciating conditions.

Orange County, CA’s Home price forecast score reached 47/ 100 in 2025. Access the home price forecast score chart here. [Link]
This latest score marks a notable drop from the peak of 68 in 2022–2023 and even down from 60 in 2024–2025, reflecting a clear cooling of Orange County’s once red-hot housing market. The downtrend suggests that while the market is not in full decline, buyers are gaining more negotiating power. Sellers, in turn, may need to adjust pricing expectations and be more flexible to close deals.
For both homeowners and investors, this evolving Orange County market calls for cautious planning and strategy recalibration amid changing demand and pricing dynamics. With Reventure’s premium plan for just $39/month, you gain access to state, metro, county, and ZIP code–level forecasts on inventory, pricing, value trends, and market strength. Whether you’re planning to buy smart, sell competitively, or track future moves, Reventure delivers the local data edge you need to stay ahead.
Access Housing Market data for California and All Other U.S. States on Reventure App.
{
“@context”: “https://schema.org”,
“@type”: “Article”,
“mainEntityOfPage”: {
“@type”: “WebPage”,
“@id”: “https://reventureapp.blog/orange-county-ca-housing-market-situation-in-2025/”
},
“headline”: “Orange County, CA Housing Market Situation in 2025”,
“image”: “https://reventureapp.blog/wp-content/uploads/2025/07/Orange-County-CA-Housing-Market-Situation-in-2025.jpg”,
“author”: {
“@type”: “Organization”,
“name”: “”,
“url”: “https://reventureapp.blog/author/reventure-data/”
},
“publisher”: {
“@type”: “Organization”,
“name”: “”,
“logo”: {
“@type”: “ImageObject”,
“url”: “”
}
},
“datePublished”: “”
}


