Reventure App provides a Home Price Forecast Score for over 30,000 ZIP codes across America, updated monthly, to premium users. This score, ranked from 0 to 100, is an index that predicts where home prices are trending in the next 12 months by evaluating the supply and demand factors in the market. This score proved very accurate at predicting future home price movements in 2024, and was actually 2x better than Zillow’s forecast. In this post, I will explain how homebuyers and investors can utilize the score to make more informed home-buying and investment decisions, and also provide more detail about its accuracy.
Reventure Score – the basics
Reventure App first introduced the Home Price Forecast score upon its app launch in 2023 to help homebuyers and investors better understand where their local housing markets were trending, and if prices would go up or down in the future.
If a market has a very low score (well below 50), it indicates a buyer’s market, with a greater likelihood of declining prices. Buyers and investors should exercise caution in markets with lower scores and submit more conservative offers (you’ll have a better chance of getting them accepted). It might also make sense to wait out sellers in a market with a low score, as prices could drop further into the future.
Conversely, if a market has a high score (well above 50), it signals a seller’s market and a greater likelihood that values will keep rising in the next 12 months. As a result, it’s better to buy now than to wait.
Reventure’s Home Price Forecast Score performed very well in predicting home price growth in America from 2023-24, ensuring that homebuyers and real estate investors can feel confident in using this tool to make more educated decisions about where and when to buy a home in 2025.
Reventure Home Price Score – results in 2024
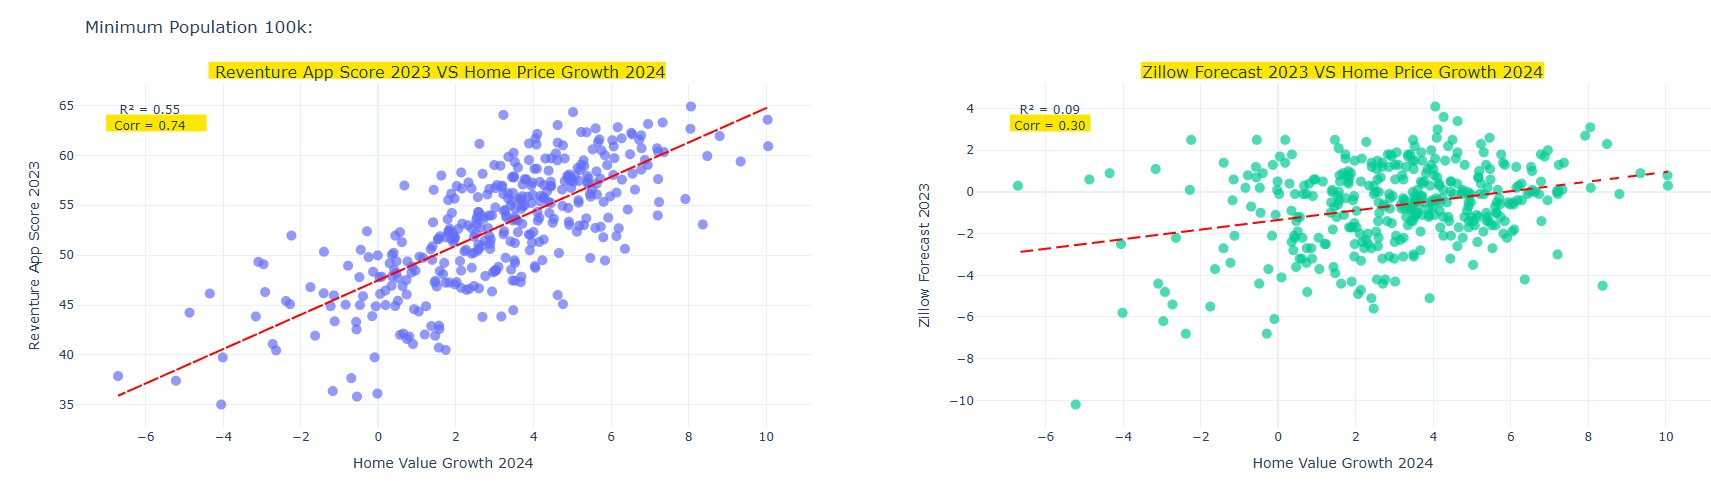
The scatter plot below shows that Reventure’s Home Price Forecast Score achieved a 74% correlation coefficient in predicting home price growth from October 2023 to October 2024 across large metros in America that had a minimum population of 100,000+.
This performance is strong, and unmatched among other real estate prediction tools. For example – Austin, TX had a Reventure Price Score of 35/100 in October 2023, well below average. Over the next 12 months, home prices in Austin dropped by -4.05%, as the score predicted. Homebuyers and investors who consulted the Reventure score for Austin, TX in late 2023 would have been wise to the fact that prices would continue dropping.

The correlation coefficient of 74% highlights how the score was consistently good at predicting price growth across different markets – including markets where home prices increased. For instance, Albany, NY registered a Reventure Score of 59/100 in October 2023, well above average. This score indicated a seller’s market in Albany and a greater likelihood of rising prices in the future. Sure enough, home values increased by +6.09% over the next 12 months.

This particular comparison is instructive. If you had polled 1,000 random realtors or homebuyers in late 2023, the vast majority would have anticipated Austin, TX to outperform Albany, NY. But the exact opposite occurred. And Revenutre App saw it coming.
Reventure Score Accuracy – Reliance on Supply/Demand Fundamentals
The reason Reventure’s Price Score is accurate is because it relies on the objective supply/demand fundamentals in the market. Trends in inventory, days on the market, price cuts, appreciation, and mortgage rates are analyzed to give a data-driven indication of the direction of each individual housing market.
When inventory is low, price cuts are low, and days on the market are declining – that’s a buyer’s market. And fertile ground for home price appreciation.
Meanwhile – when inventory is at record highs, price cuts are spiking, and days on the market are rising – that’s a seller’s market. And fertile ground for price declines.
Reventure’s commitment to analyzing the hard data, and nothing else, is what makes its score so good at predicting price movements.
Comparison to Zillow’s Price Forecast from 2023-24
To establish a point of comparison to truly assess whether Reventure’s Price Forecast is valuable, we compared it to Zillow’s Home Value Forecast.
Each month, Zillow updates its annual home price forecast for metros across America. Reventure dug into the archives and found their October 2023 Home Price Forecasts by metro, and compared it to the actual home value growth Zillow reported in these metros over the next 12 months.
The result? Zillow achieved a 0.30 correlation coefficient when comparing their October 2023 forecasted price movements to October 2024 actual YoY price growth.
Reventure’s forecast performed over 2x better.
Disclaimers and limitations
Reventure App’s Price Forecast is not perfect and is subject to error. Predicting the future direction of home prices is difficult, and Black Swan events can tilt the direction of home price growth on a dime. As a result, we recommend exercising caution in utilizing this score. Utilize as a tool to better understand future market trends, but also understand that there is significant uncertainty in the future direction of home price movements.
Moreover – Reventure’s score becomes less accurate in predicting price movements at smaller geographies. The point of comparison in this blog post measured Reventure’s forecast for larger metro areas with a population of over 100,000 people. However, when removing this population filter, and examining all metro areas (of which there are nearly 1,000), the score’s correlation coefficient was reduced to 0.56.
Going down further into county and ZIP code levels reduces the score’s accuracy further, as smaller sample sizes, fewer listings, and fewer home sale transactions invite more randomness into the equation.
As a result: make sure to consult the Reventure App Score not just at your ZIP code level, but also across your county and metro for a fuller perspective on the dynamics in the market.
How to Access the Score
The score can be accessed through two main methods: one is by selecting the Home Price Forecast from the data point dropdown on the web and mobile applications, or by accessing the scorecard page on the web and mobile applications.
Viewing the score requires the purchase of a premium membership to Reventure App.
Please feel free to reach out to Reventure App if you have any questions on the score: helpdesk@reventure.app.