I was recently pondering an interesting question: how much will mortgage rates need to drop in order to bring homebuyers back into the housing market in 2024 and beyond?
Answering this question is of paramount important for homebuyers, investors, and sellers. Because it will give key insights into when the housing market hits a bottom, and eventually when it will recover.
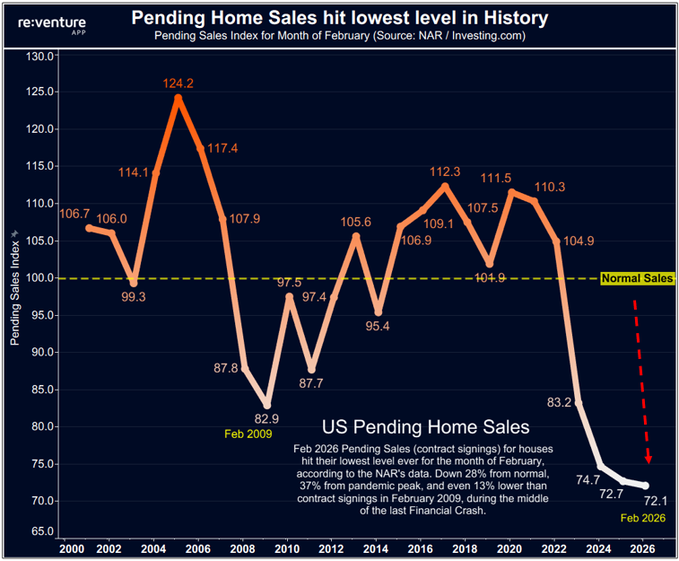
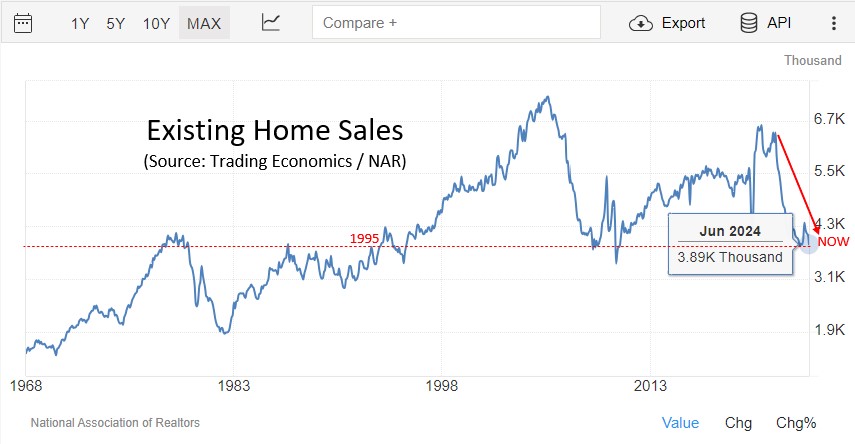
Home sales continue to drop. Down to 3.89 million annualized in June 2024.
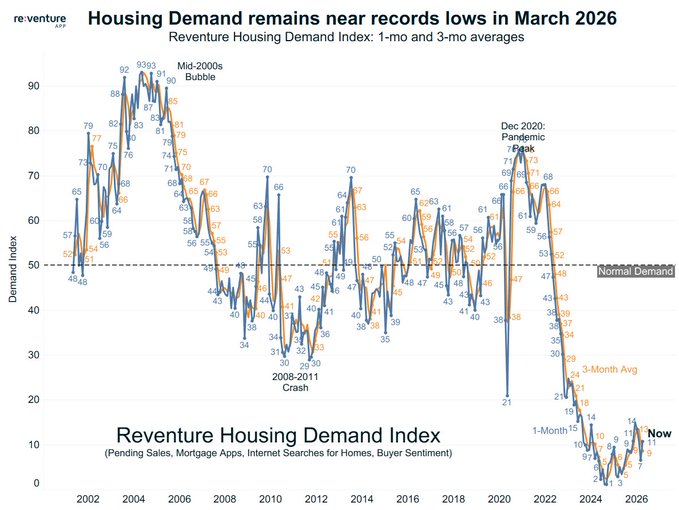
The first thing to understand about the housing market in summer 2024 is that homebuyer demand remains near the lowest levels on record. And it continues to drop. With the National Association of Realtors reporting today that existing home sales dropped to a 3.89 million annualized level in June 2024, down 5.4% from last year. And scraping the lowest levels we have seen in the last 30 years, going back to 1995.
These plunging home sales reinforce the notion that homebuyers remain on strike and are refuse to come back into the housing market. One reason they are hesitant is because home prices in America continue to go up on a national basis. With the existing sale price of an existing house hitting $426,900 in June 2024. Up 4.1% from last year.
While many housing market pundits are celebrating the fact that prices are still high, they shouldn’t. Because it’s these sky-high prices which are putting buyers on the sidelines.
Mortgage rates would likely need to drop below 5% before homebuyers come back, assuming home prices don’t decline
This begs an interesting question. Say, for a moment, that home prices don’t drop from here. And stay roughly flat for the next 2-3 years. In that hypothetical situation, how much would mortgage rates need to go down before we see homebuyer demand return to its normal, pre-pandemic level?
One way to answer this question is by looking way back into history, at the long-term trend in home-buying costs in America. Specifically: how much has the cost of buying a home increased over the last 50 years in terms of a buyer’s monthly payment?
You can see on the graph below that buyers today need to shell out $2,800/month for their mortgage, taxes, and insurance as of June 2024. That’s an unprecedented level with no historical context. One that is almost 2x more expensive than the cost of buying directly before the pandemic. No wonder so many buyers are on strike.
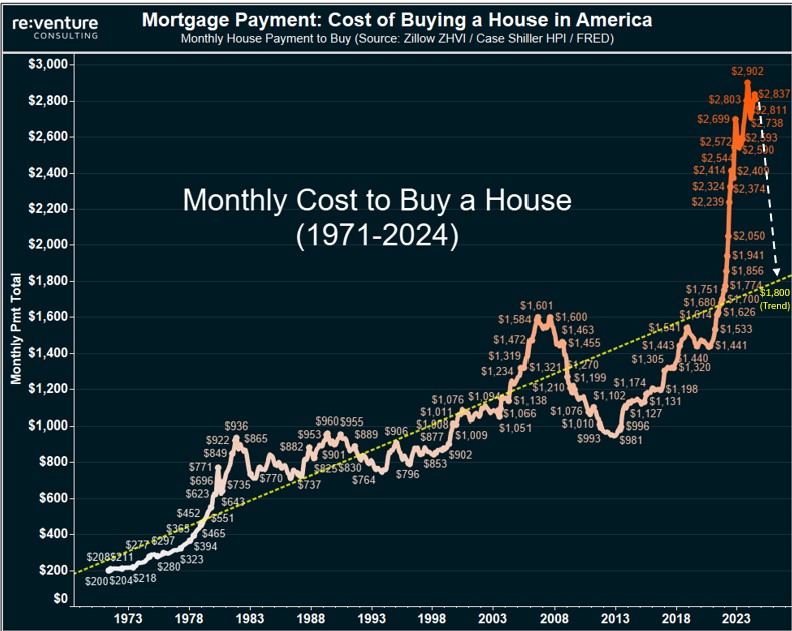
Now I want you to pay attention to the yellow dotted trend line. This yellow line fits to the long-term “trend” in mortgage payments over the last 50 years, and suggests that today’s baseline payment should be around $1,800/month, roughly 36% cheaper than current levels today. That is – if prices and mortgage rates grew at their long-term trend rate.
Of course – they haven’t over the last 2-3 years. Mortgage rates have spiked, while prices have refused to come down meaningfully. Created the ridiculously unaffordable market we have today. However – I suspect there is some value in looking at the long-term trend, because I have a feeling if mortgage payments feel closer to the $2,000/month level, we’d see buyers come back.
Mortgage Rate v Mortgage Payment Matrix
However – there’s a problem. There’s no real for the monthly mortgage payment for buyers, inclusive of taxes and insurance, to drop below $2,000/month purely based on mortgage rate declines. You can see this exemplified clearly on the table below.
With today’s 6.90% mortgage rate corresponding to a roughly $2,800/month payment. From there, you can see how the monthly payment declines as mortgage rates drop by 0.25% increments. What immediately becomes apparent is how “non-sensitive” payments are to mortgage rates.

You can see that if mortgage rates were to go below 6%, the monthly payment would only go down to $2,591/month, a mere 8% savings. That’s not going to be nearly enough to bring buyers back into the market.
From there – if mortgage rates were to drop below 5%, the monthly payment would go to $2,436/month. Which is starting to get in the territory of more affordable. However, even then, that’s still only a 13% savings compared to current rates.
In reality – if home prices don’t drop, mortgage rates will need to plummet in order to bring buyers back into the market.
Home Price v Mortgage Payment Matrix
On the flip side – watch what happens to payment levels when prices drop. Assuming home prices drop 10% from their current levels, the typical mortgage payment for homebuyers would go down to $2,596/month. A similar improvement to if mortgage rates drop by 1%.
Meanwhile, if home prices were to drop by 20% from their current peak, then the monthly payment would plummet all the way down to $2,245/month. Which would be an equivalent savings to if mortgage rates dropped to 4%.

The reason home prices impact mortgage payments more than mortgage rate is twofold. For starters, lower home prices mean the total loan amount taken out is lower, which directly improves the affordability of purchasing a home and leads to lower monthly payments. In addition, lower home prices could also mean lower property tax and insurance costs in the future, which would also improve affordability.
What if both Home Prices and Mortgage Rates Drop?
Now – there is an alternative, third scenario. What if both home prices and mortgage rates drop over the next several years? How quickly could that return affordability to the housing market?
In reality – this is the scenario that everyone in real estate needs to be pulling for. Whether you’re a homebuyer, realtor, investor, or real estate tech company. Declining prices AND rates is the only way we can return equilibrium to the housing market and restore affordability to where it needs to be.
In the table below you can see a host of different scenarios for what mortgage payments would look like if rates and prices dropped by different levels. The highlighted cell in the top left, $2,806, reflects today’s typical payment for home buyers. The highlighted cell in the middle, $2,114, shows what the payment would be if mortgage rates drop to 5.4% and home prices decline by -15%.

Ultimately – this payment would still be above what the long-term trends expects. However, I think if the mortgage payment were to drop by this much (roughly 25%), it would be enough to entice buyers back in. And restore homebuyer demand to pre-pandemic levels.
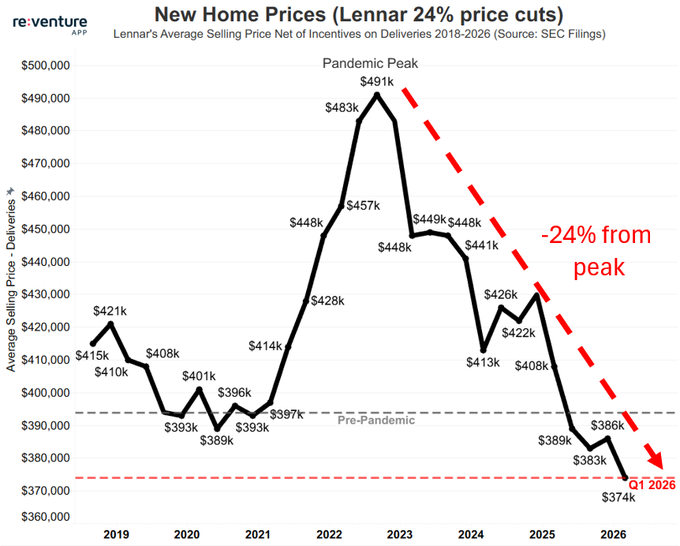
In some ways this thesis has already been proven out by homebuilders. Builders have reduced prices by 10% from their peak on average, and some builders have operated closer to 15% price cuts. At the same time, builders are also giving generous mortgage rate buydowns that bring rates into the mid-5% range in many cases.
This combination of price reductions and mortgage incentives has allowed builders to achieve home sale velocity roughly on par with what it was before the pandemic.