Greenville, SC Homes for Sale Reached 2,445 As Inventory Surged by 18.4% in 2025
 February 18, 2025
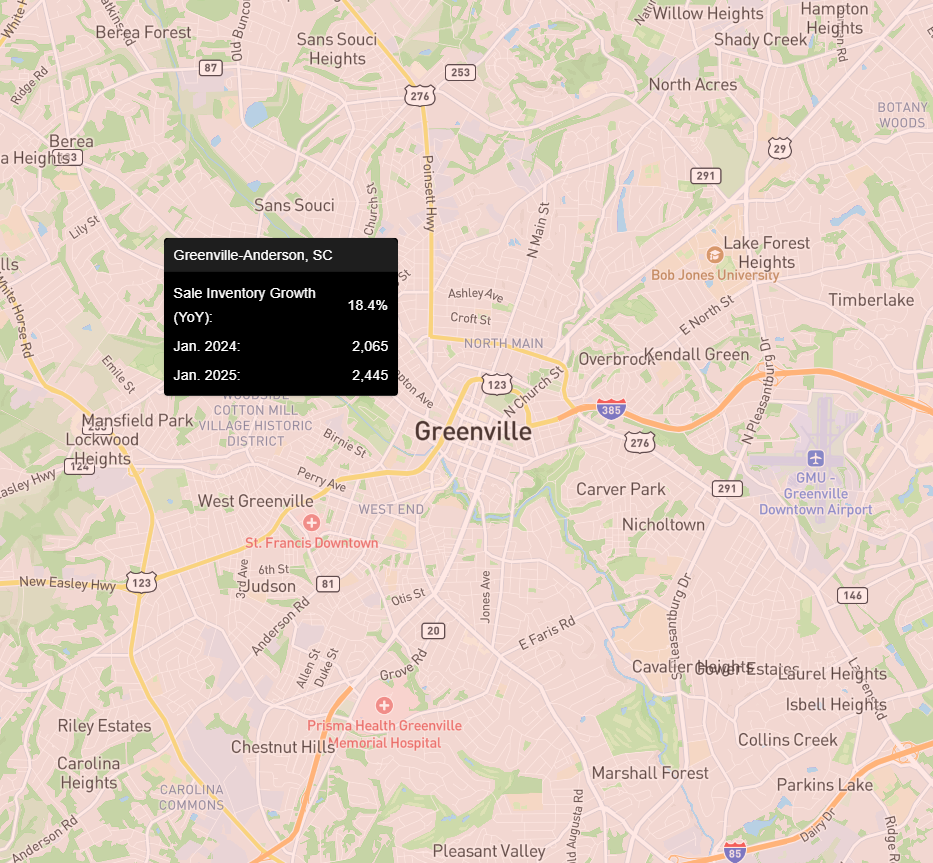
In 2025, Greenville, SC’s housing market experienced a significant shift, with homes for sale reaching 2,445, marking an 18.4% year-over-year inventory growth from 2,065 in January 2024. This surge in inventory suggests more options for buyers and indicates cooling demand. With increased supply, home prices can face downward pressure. This means buyers will find better deals and negotiation opportunities, while sellers must adjust pricing strategies to stay competitive in the evolving market.
Greenville, SC’s Home for Sale Analysis Over the Years
Over the years, Greenville, SC’s housing market has experienced significant shifts. For instance, before the pandemic (2018-2019), the housing market was relatively stable. The number of homes for sale remained above 3,000, peaking at 3,857 in 2018 and fluctuating slightly in 2019 (3,217). Sale inventory growth remained moderate, with YoY changes of 4.6% in 2019. The market maintained a healthy balance between buyers and sellers.
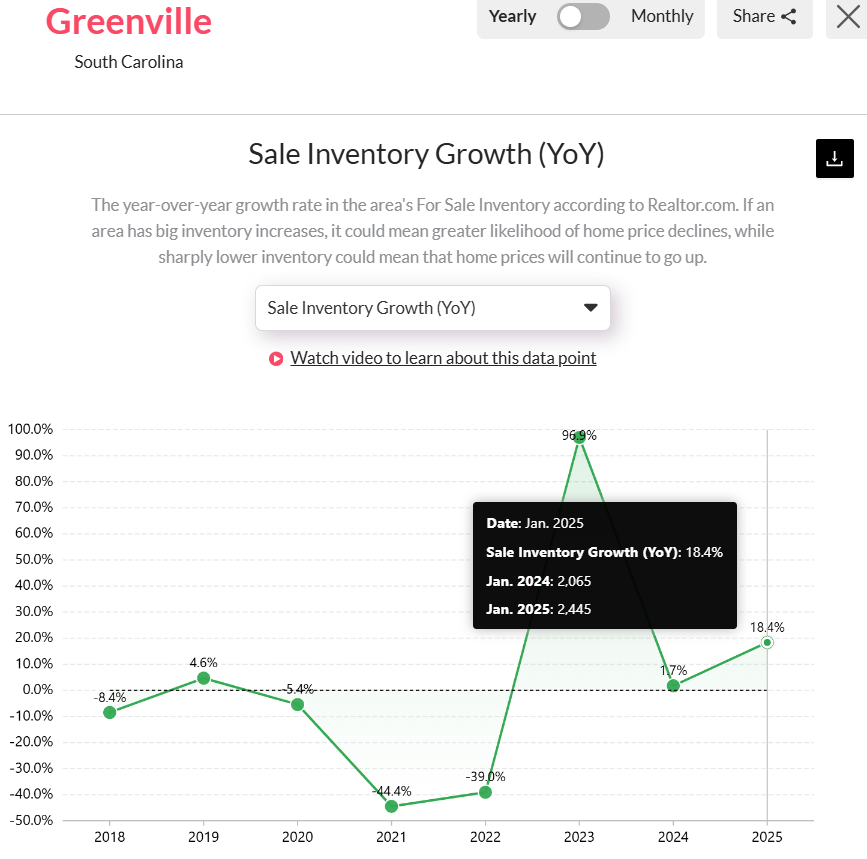
Greenville, SC’s homes for sale increased by 18.4% in 2025. Access the above sales inventory growth YoY map of the metro here. [Link]
During the pandemic (2020-2021), inventory dropped sharply due to reduced listings and high buyer demand fueled by low mortgage rates. By 2021, the for-sale inventory dropped to just 1,030 homes, reflecting a 44.4% drop in YoY inventory growth. This created a strong seller’s market, pushing home prices up.
After bottoming out in 2022, inventory steadily recovered, rising to 2,029 in 2023 and 2,445 in 2025 (18.4% YoY growth). As more homes hit the market, buyers gain more options, potentially leading to increased price negotiations and longer days on the market.
Homes for Sale Trend in Counties of Greenville, SC
The Greenville, SC metro area, consisting of Greenville, Pickens, Anderson, and Laurens counties, has seen a significant increase in homes for sale in 2025. Inventory growth across these counties suggests a market shift, potentially providing buyers with more options while putting pressure on sellers to adjust pricing strategies.
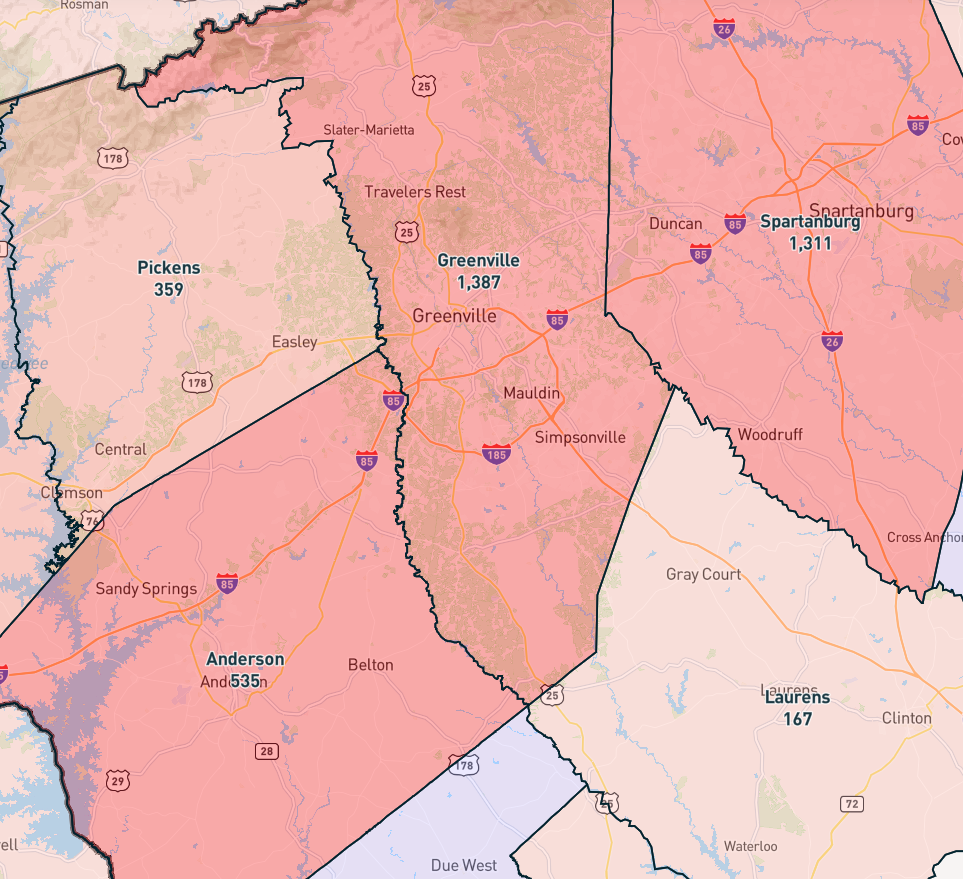
Pickens County showed the highest homes for sale increase in the Greenville metro. Access the Homes for Sale map of the counties here. [Link]
Greenville County recorded 1,387 homes for sale, marking a 19.6% year-over-year increase. This rise in inventory reflects a growing supply of homes and a shift from a solid sellers’ market to a buyers’ market. Pickens County experienced the most dramatic inventory growth, surging by 41.6% YoY to 359 homes. Anderson County had a more modest increase in inventory, with 535 homes for sale, reflecting a 7.2% YoY growth.
Moreover, Laurens County, the smallest in the metro area, had 167 homes listed, showing a 9.5% YoY increase. Overall, the rise in inventory across all four counties indicates that the Greenville metro housing market is transitioning. As supply increases, buyers may gain more leverage, and sellers might need to adjust their pricing and marketing strategies to attract offers.
Greenville, SC’s Housing Market Predictions in 2025
In 2025, Greenville, SC’s housing market is expected to remain stable but with a downward tilt, as indicated by a home price forecast score of 46 out of 100. It is important to note that on Reventure App, a score of 45 to 49 indicates stability with a downward tilt. This places it on the lower end of stability, suggesting a potential cooling of the market.
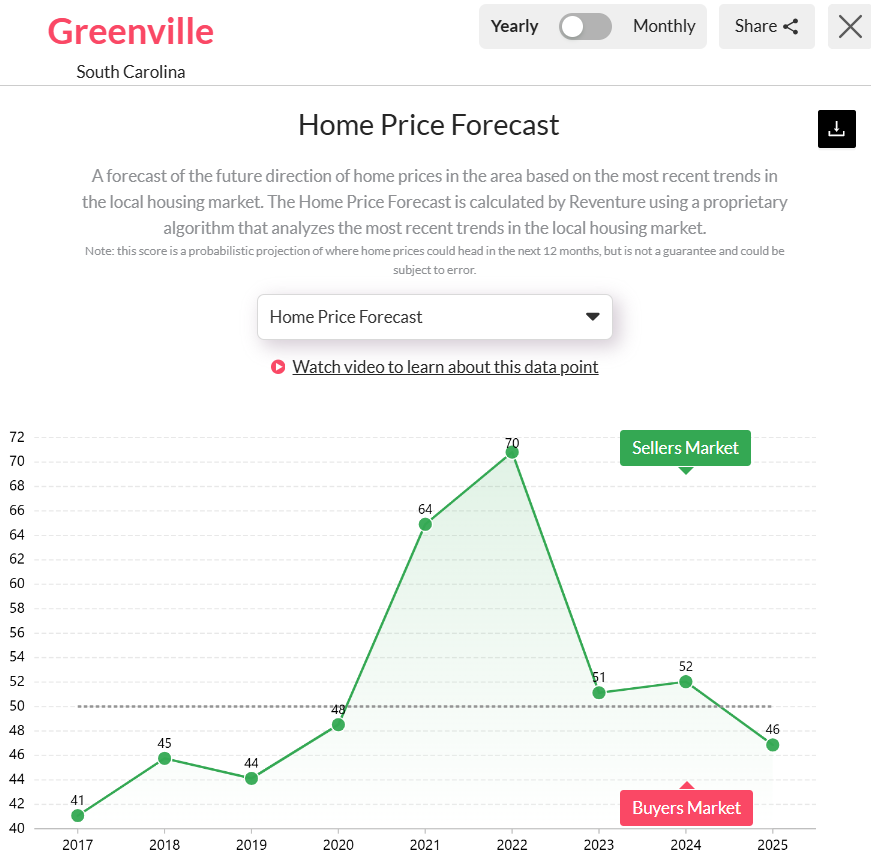
Greenville, SC Home price forecast score reached 46/ 100 entering 2025. Access the home price forecast score chart here. [Link]
With inventory increasing, more homes are available for buyers, which could lead to longer days on market and more price cuts. While the market previously favored sellers, this shift suggests that buyer demand is softening. If this trend continues, the increase in active listings will put downward pressure on home prices, making it a less competitive environment for buyers.
Sellers will need to adjust pricing strategies as homes take longer to sell. If demand weakens further, Greenville could edge closer to a declining market. However, if economic conditions stabilize, the market could maintain its balance without experiencing drastic home price drops. If you want a detailed analysis of the Greenville, SC metro area, explore the housing market data at the ZIP-code level on Reventure App.
Access Housing Market data for the District of South Carolina and other States on Reventure App.