Austin’s housing market is no longer the red-hot story it once was. Prices that soared in 2021 are now cooling fast. Buyers feel the change with more choices and more time to decide. Sellers, on the other hand, face longer waits and deeper cuts.
According to the data available on Reventure App, 2025 is shaping up as another year of decline. From Travis County to Williamson, every corner of the metro is adjusting. The question is simple: how much further will values fall? Let’s break down the latest data and see where Austin’s market is heading.
Austin, TX’s Home Value Growth YoY Dropped to -5.8% in 2025
Austin home values are facing another decline in 2025. Growth has fallen to -5.8%, marking the second straight year of negative change. According to the data available on Reventure App, this decline continues the cooling that started after the pandemic boom.

Austin, TX’s home value growth dropped to -5.8% in 2025. Access the home value YoY growth graph of the metro here. [Link]
The sharpest swing came in 2021, when values jumped 40.3%. That was the peak of the market. By 2022, the pace slowed to 15.2%. In 2023, prices crashed to -13.0% before showing a small recovery in 2024 with -4.6%. The 2025 figure of -5.8% confirms that the market is still under pressure.
This trend reflects a reset after years of fast growth. Buyers are more cautious. Mortgage rates and higher living costs have changed demand. Sellers now face longer waits and more price cuts. The market is trying to balance, but the data shows weakness remains. Austin housing is no longer at its peak.
Housing Market Trends in the Counties of Austin, TX, in 2025
The Austin housing market shows wide differences across its counties. According to the data available on Reventure App, Travis County leads with the largest inventory. It has 6,558 homes for sale. Home value growth fell by -6.9%. Price cuts hit 35.1%. Homes now stay on the market for about 73 days.

The number of homes for sale in Travis County reached 6,558 in 2025. Access the above map here. [Link]
Williamson County follows with 3,462 listings. Growth dropped -4.6% in 2025. Price cuts are even higher at 37.2%. Homes sell faster here, with an average of 65 days on the market. The county is also more overvalued at 7.1% compared to Travis.
Hays County recorded -5.8% growth. It has 1,530 active listings. Price cuts are lower at 29.2%, but days on market reached 74. Bastrop shows softer declines. Growth fell only -2.4%. But homes linger longer with 82 days on the market. Overvaluation is a concern at 16.6%.
Caldwell County is the smallest market with just 169 listings. Growth declined -3.5%. Price cuts are the lowest at 21.7%. Yet homes take the longest to sell, with an average of 93 days. This shows a slower pace of demand despite a smaller supply.
Austin, TX’s Housing Market Predictions for 2025 – 2026
The forecast score for Austin fell to 28 out of 100 in 2025. This places the metro deep in a declining market, according to the data available on Reventure App. A declining market means reduced buyer demand, more sellers, longer days on market, and more price cuts. It also points to future home price declines.
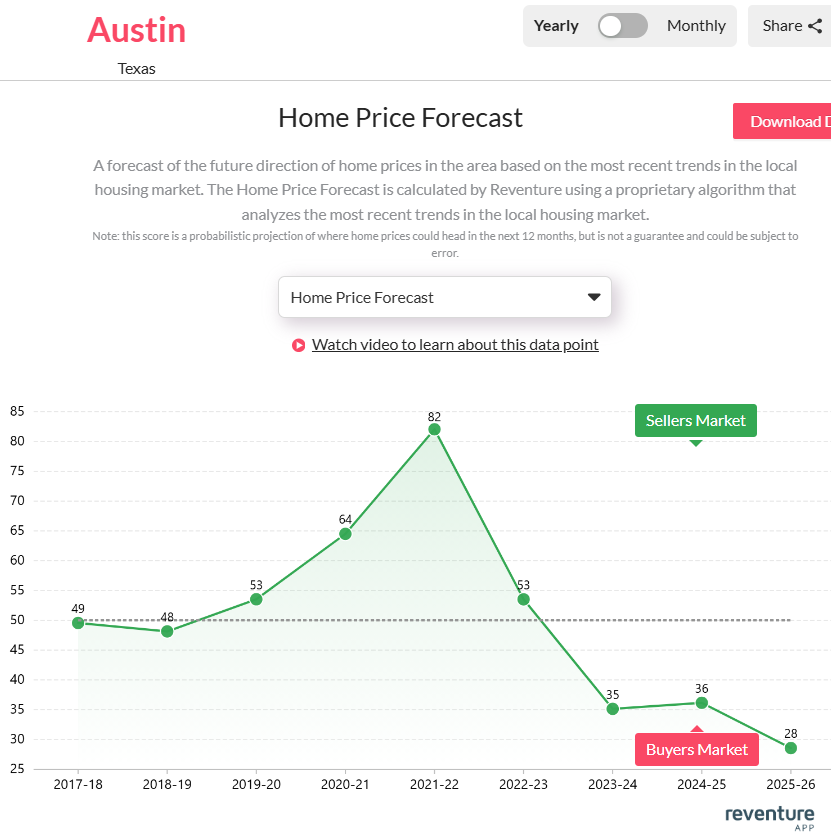
Austin, TX’s Home price forecast score reached 28/ 100 in 2025. Access the home price forecast score chart here. [Link]
This is a sharp change from past years when Austin was a hot sellers’ market. The score peaked at 82 in 2021-22 but has fallen every year since. With a reading well below 45, Austin is now expected to stay weak through 2026. Buyers may wait for further drops, while sellers face pressure to adjust prices. The next year looks set for more cooling, not recovery.
Local Insight with Reventure App
Access Reventure App’s 12-month price forecast in your ZIP Code in Texas under a premium plan. That way, you can figure out how much the price could drop. Our forecast is the most accurate, widely available housing forecast and is currently performing 6x better than Zillow’s.
You can access this forecast, along with 40+ additional premium housing market data points, for just $49 per month. (That’s less than 0.02% of the cost of buying a house).