Provo, UT Sees 16.7% Increase in Days on Market as Homes for Sale Reach 1,934 in 2025
 February 11, 2025
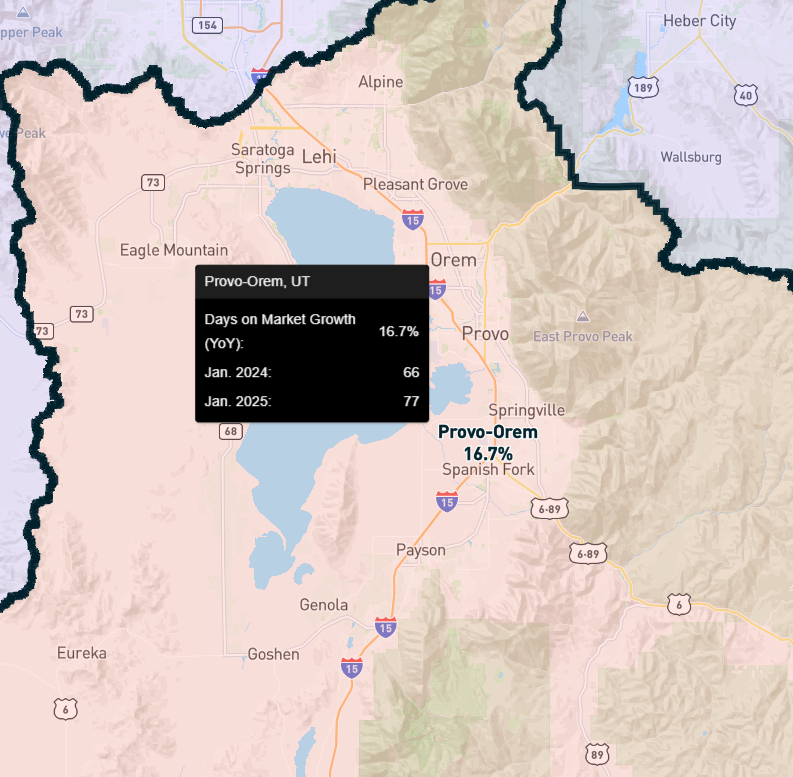
At the start of 2025, the Provo-Orem, UT housing market is experiencing a notable decline, with homes staying on the market longer. Data available on Reventure App shows a 16.7% year-over-year increase in Days on the Market, rising from 66 days in January 2024 to 77 days in January 2025. The homes for sale have also grown to 1,934, reflecting changing market conditions in the metro. This trend suggests a cooling market, which means buyers will have more negotiating power, while sellers need to adjust pricing or incentives to attract buyers.
Provo, UT’s Days on the Market Analysis Over the Years
Provo, UT’s housing market has seen significant fluctuations over the years, with Days on Market (DOM) varying based on economic conditions, mortgage rates, and buyer demand. Before the pandemic, the market was relatively stable. In 2017, homes stayed on the market for 62 days, but as demand increased, DOM dropped to 49 days in 2018 (-20.9% YoY). By 2019, DOM rose slightly to 57 days (15.3% YoY), indicating a slight slowdown in selling.
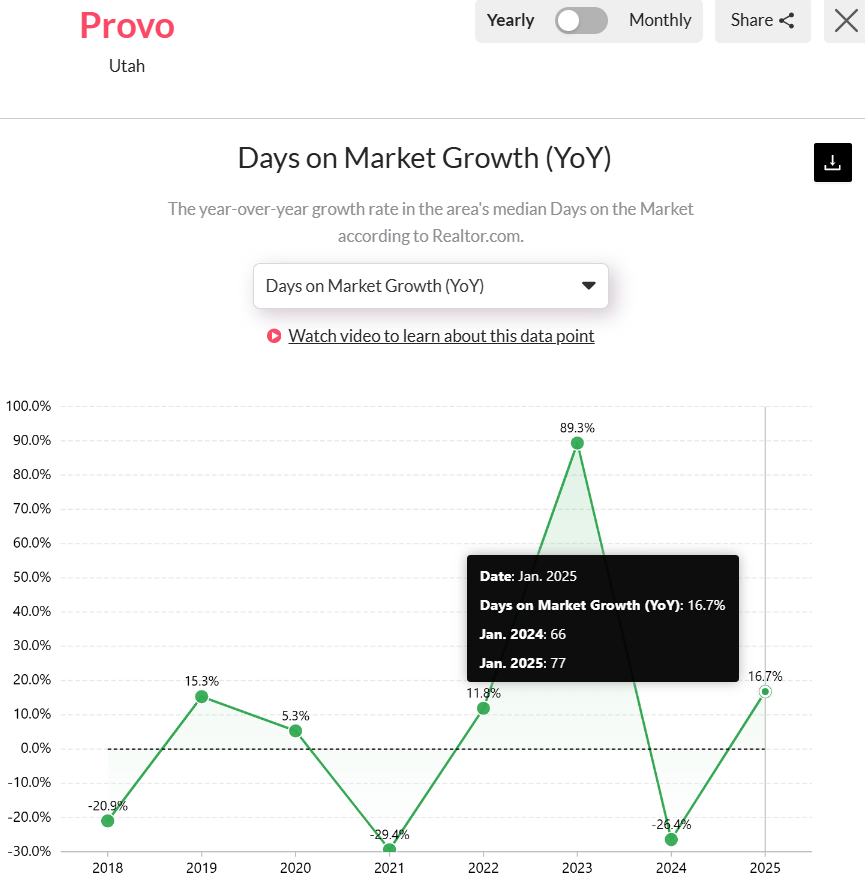
The DOM of Provo, UT reached 77 days indicating a 16.7% YoY growth. Access the DOM YoY growth chart of Provo, UT here. [Link]
During the pandemic, historically low mortgage rates fueled a buying frenzy. In 2020, DOM slightly increased to 60 days (5.3% YoY), but in 2021, it dropped to 42 days (-29.4% YoY) due to heightened demand. However, by 2022, DOM rebounded to 47 days (11.9% YoY), reflecting early signs of market stabilization.
Post-pandemic, the market declined dramatically. In 2023, DOM soared to 89 days (89.3% YoY), indicating a slowdown. In 2024, it dropped to 66 days (-26.4% YoY) but increased again in 2025 to 77 days (16.7% YoY). Moreover, inventory grew to 1,934 homes, favoring buyers as sellers face longer wait times to close deals.
Days on the Market Trend in Counties of Provo, UT
Provo, UT’s housing market has shown significant fluctuations in Days on Market (DOM) across its two counties i.e., Utah County and Juab County. In Utah County, the DOM growth has been volatile over the years. In 2023, DOM growth peaked at 87.8% YoY, indicating a slow-moving market with longer selling times. In 2024, growth declined by -25.7%, showing signs of recovery. However, in 2025, DOM increased again by 16.4%, suggesting a continued market cooldown where homes are taking longer to sell.

Juab County showed a more dramatic DOM increase compared to Utah County. Access the DOM map of the counties here. [Link]
In Juab County, the trend is even more dramatic. After a sharp increase of 56.5% in 2022, the DOM growth surged to 140% in 2023, marking a significant slowdown in selling. The market saw a correction in 2024 (-53.7% YoY), but in 2025, it rebounded by 61.1%, indicating persistent market stagnation. Overall, both counties show increasing DOM trends in 2025, reflecting rising inventory and slower buyer activity, which could shift power from sellers to buyers in Provo’s real estate market.
Provo, UT’s Housing Market Predictions in 2025
Provo, UT’s housing market is in a declining phase in 2025, with a home price forecast score of 36 out of 100, indicating reduced buyer demand and longer days on the market. This score is well below Reventure App’s stability range (45-55), suggesting future home price declines as sellers face increasing challenges. The current state of the Provo Metro makes it a solid buyers’ market.
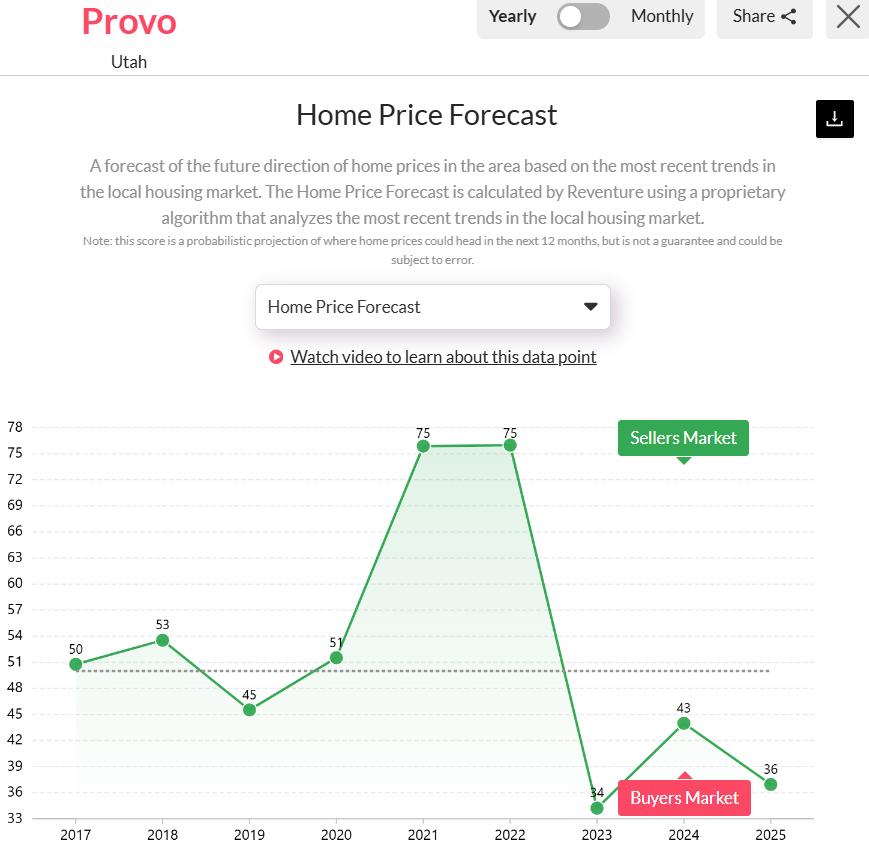
Provo, UT Home price forecast score reached 36/ 100 entering 2025. Access the home price forecast score chart here. [Link]
Provo’s market saw a strong seller’s market in 2021-2022, but recent trends indicate a buyer’s market taking shape. Unless economic conditions shift significantly, home prices are likely to decline further in 2025, and sellers may need to lower prices or offer incentives to attract buyers. Provo’s real estate landscape is transitioning, making strategic pricing and patience crucial for sellers in this cooling market. If you want a detailed analysis of the Provo, UT metro area, explore the housing market data at the ZIP-code level on Reventure App.
Access Housing Market data for the District of Utah and other States on Reventure App.